Creating a Dashboard
You can construct a MapD Immerse dashboard following these steps:
- Start a New Dashboard
- Connect to a Data Table
- Add One or More Charts
- Title and Save the Dashboard
Once you save the dashboard, you can share it with other MapD users.
Starting a New Dashboard
Connect to MapD Immerse by pointing a web browser to port 9092 on your MapD Core Database server. When you launch MapD Immerse, the landing page is a list of saved dashboards. You click New Dashboard in the upper right to configure a custom dashboard.
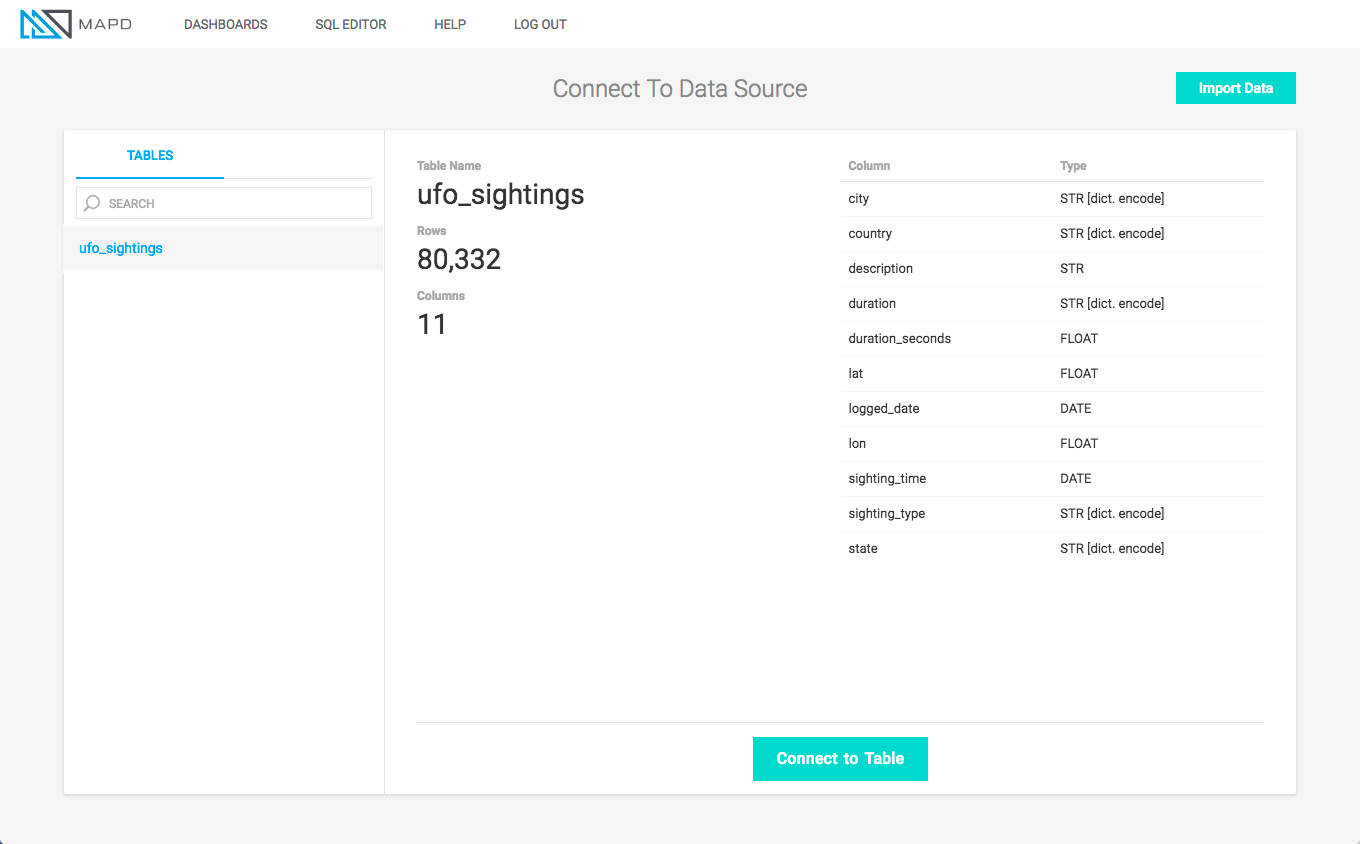
Connecting to a Data Table
When you configure a dashboard, you first select the table you want to analyze. Click the table name in the left pane to show a preview of the table’s columns and data types in the right pane. Double-click the table name in the left pane to connect to the table, or click Connect to Table in the right pane.
For example:
- Click New Dashboard.
- Select the table ufo_sightings.
- Click Connect to Table.
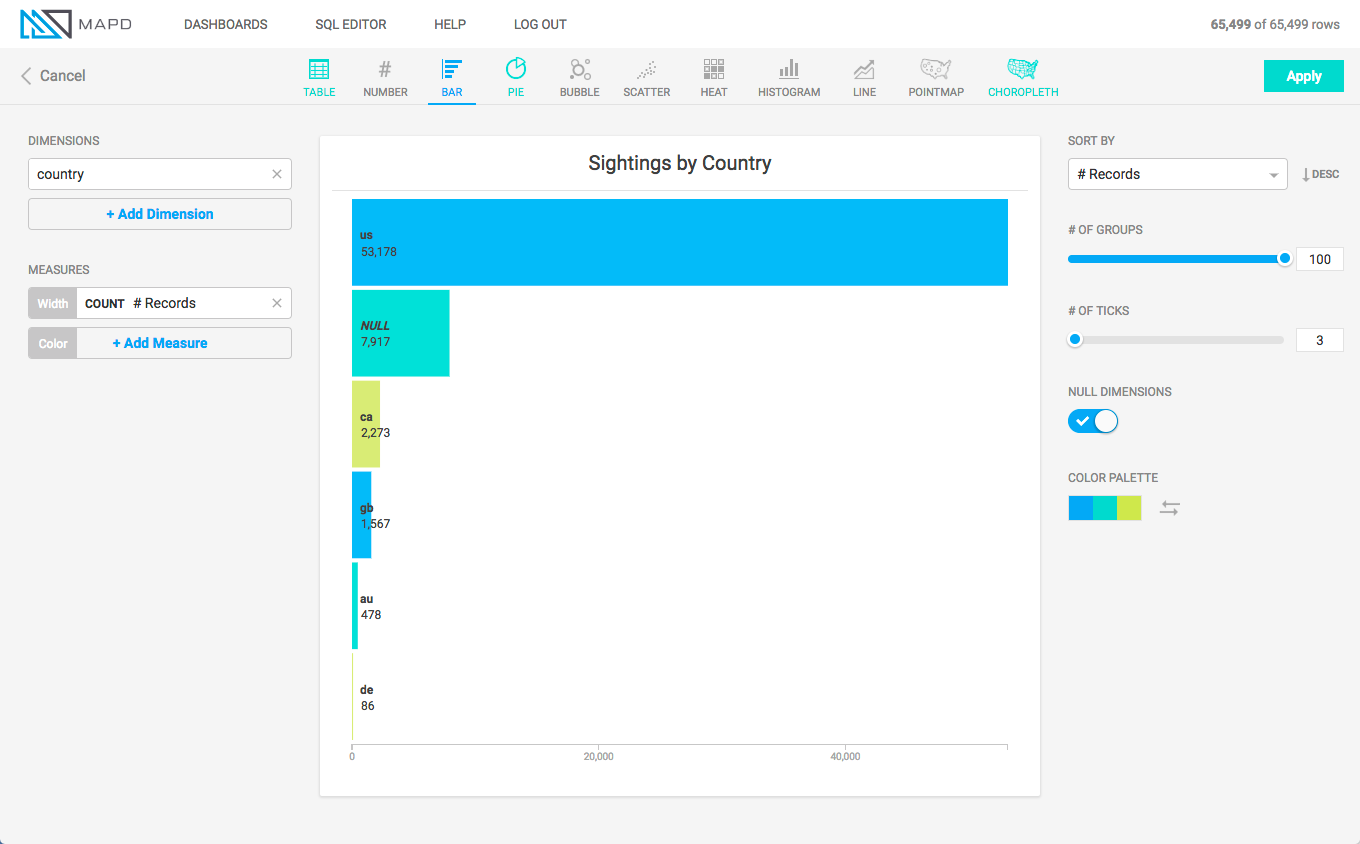
Adding a chart
To add a chart, you click Add Chart, choose a chart type, set dimensions and measures, then click Apply. For more information on creating charts, see creating-a-chart and MapD Immerse Chart Types.
For example, to create a chart using the table ufo_sightings:
- Click Add Chart.
- Choose a chart type. For example, Bar.
- Set the Dimension. For example, country.
- Set the Measure. For example, COUNT # Records.
- Click Apply.
Moving/resizing charts
To move a chart within a dashboard, click the title bar and drag the chart to the new location. If there is already at that location, it moves aside.
To resize the chart, click on the lower right corner of the chart and drag to change the size.
Cross-filtering
When you add more than one chart to a dashboard, filters on one chart affect all other charts on the dashboard.
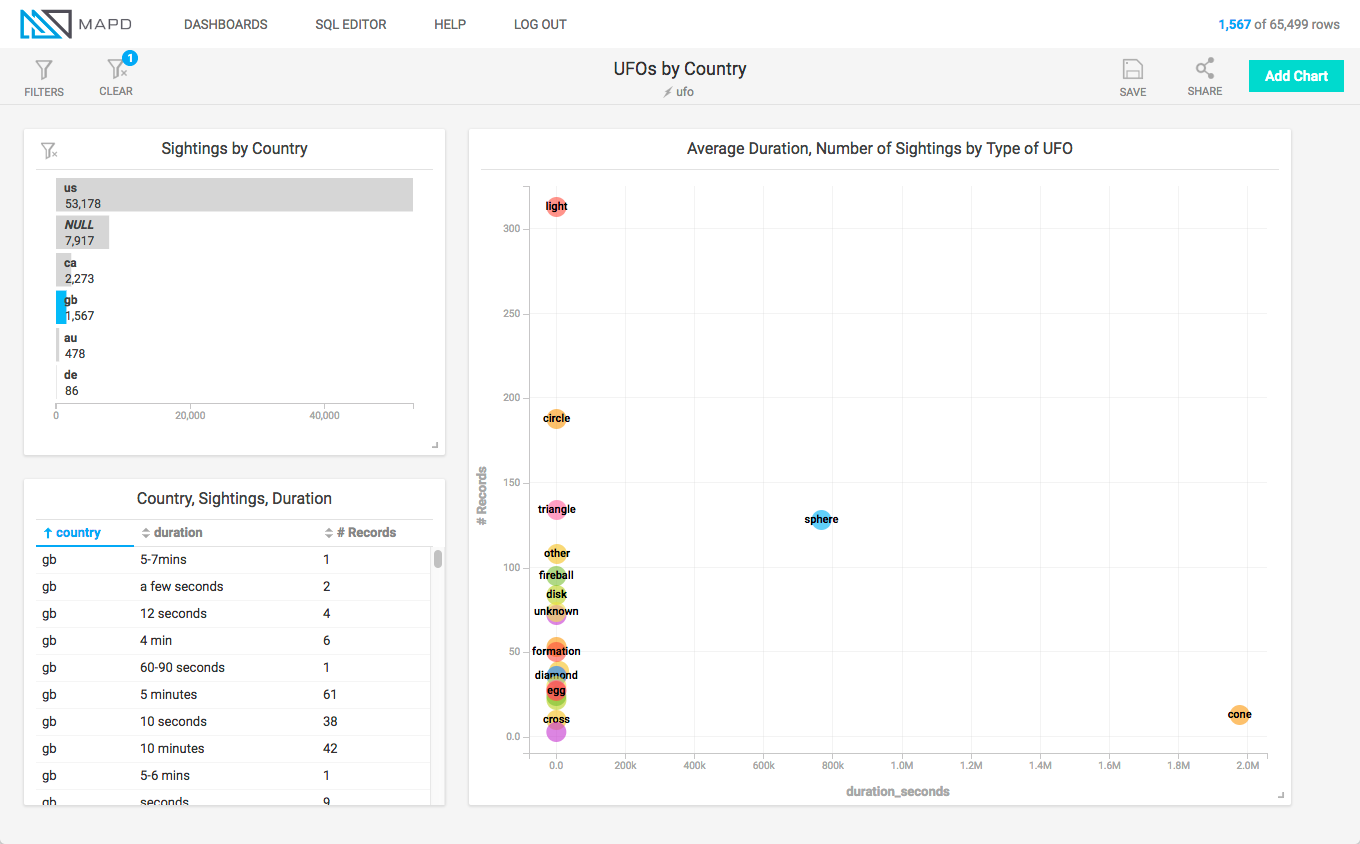
For example, the dashboard below shows UFO Sightings in various countries.
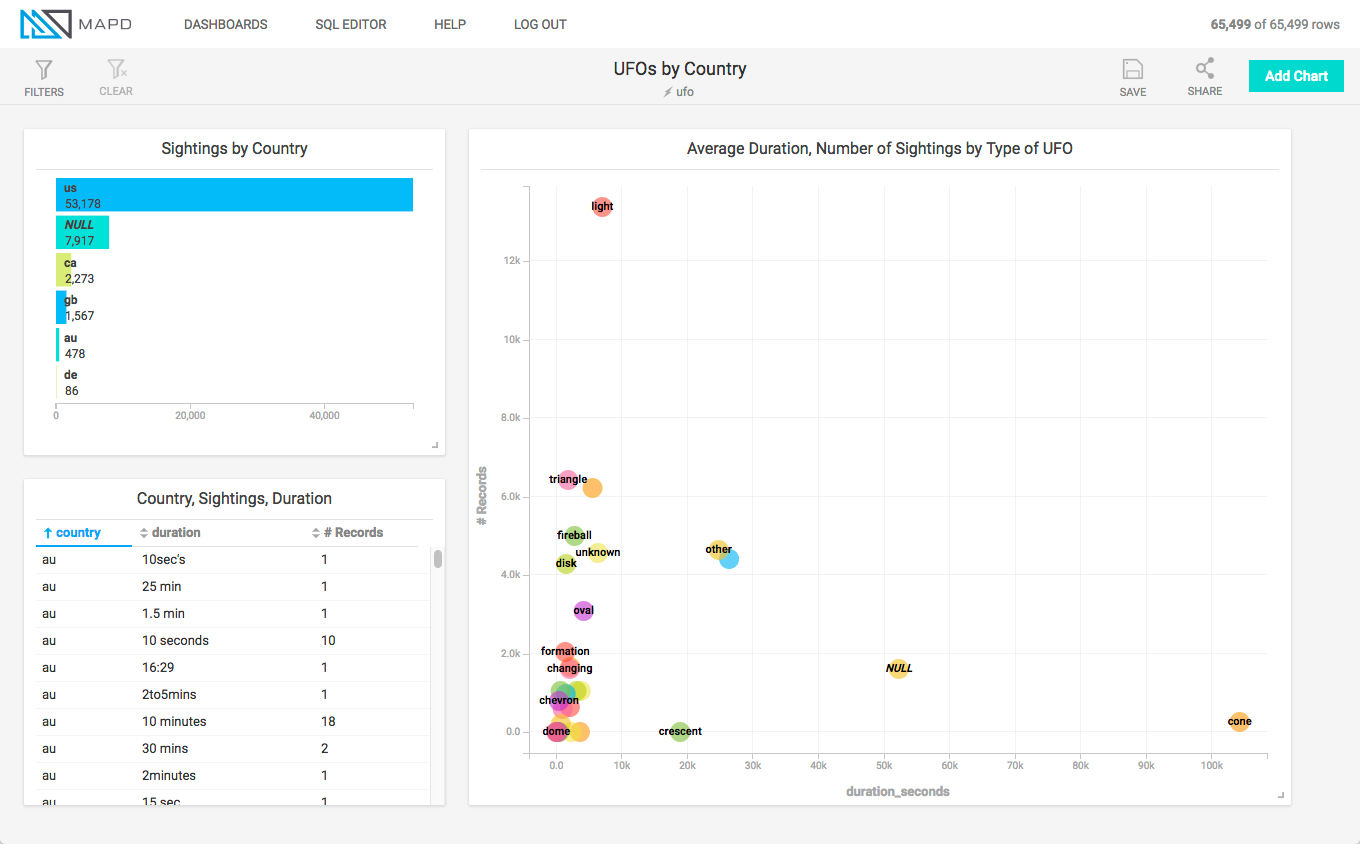
If you click the bar for Great Britain (gb) on the “Sightings by Country” chart, the other charts are filtered, as well.
Titling and Saving a Dashboard
To title and save a dashboard:
- Click the title area.
- Type a title.
- Click Save.
Sharing a Dashboard
To share a dashboard URL:
- Click Share.
- In the Share Link box, click the copy icon.
- Paste the URL into a message or online resource.
Deleting a Dashboard
To delete a dashboard:
- Click Dashboards.
- Mouse over the dashboard you want to delete.
- Click X at the end of the dashboard row.