Number Chart
What it is
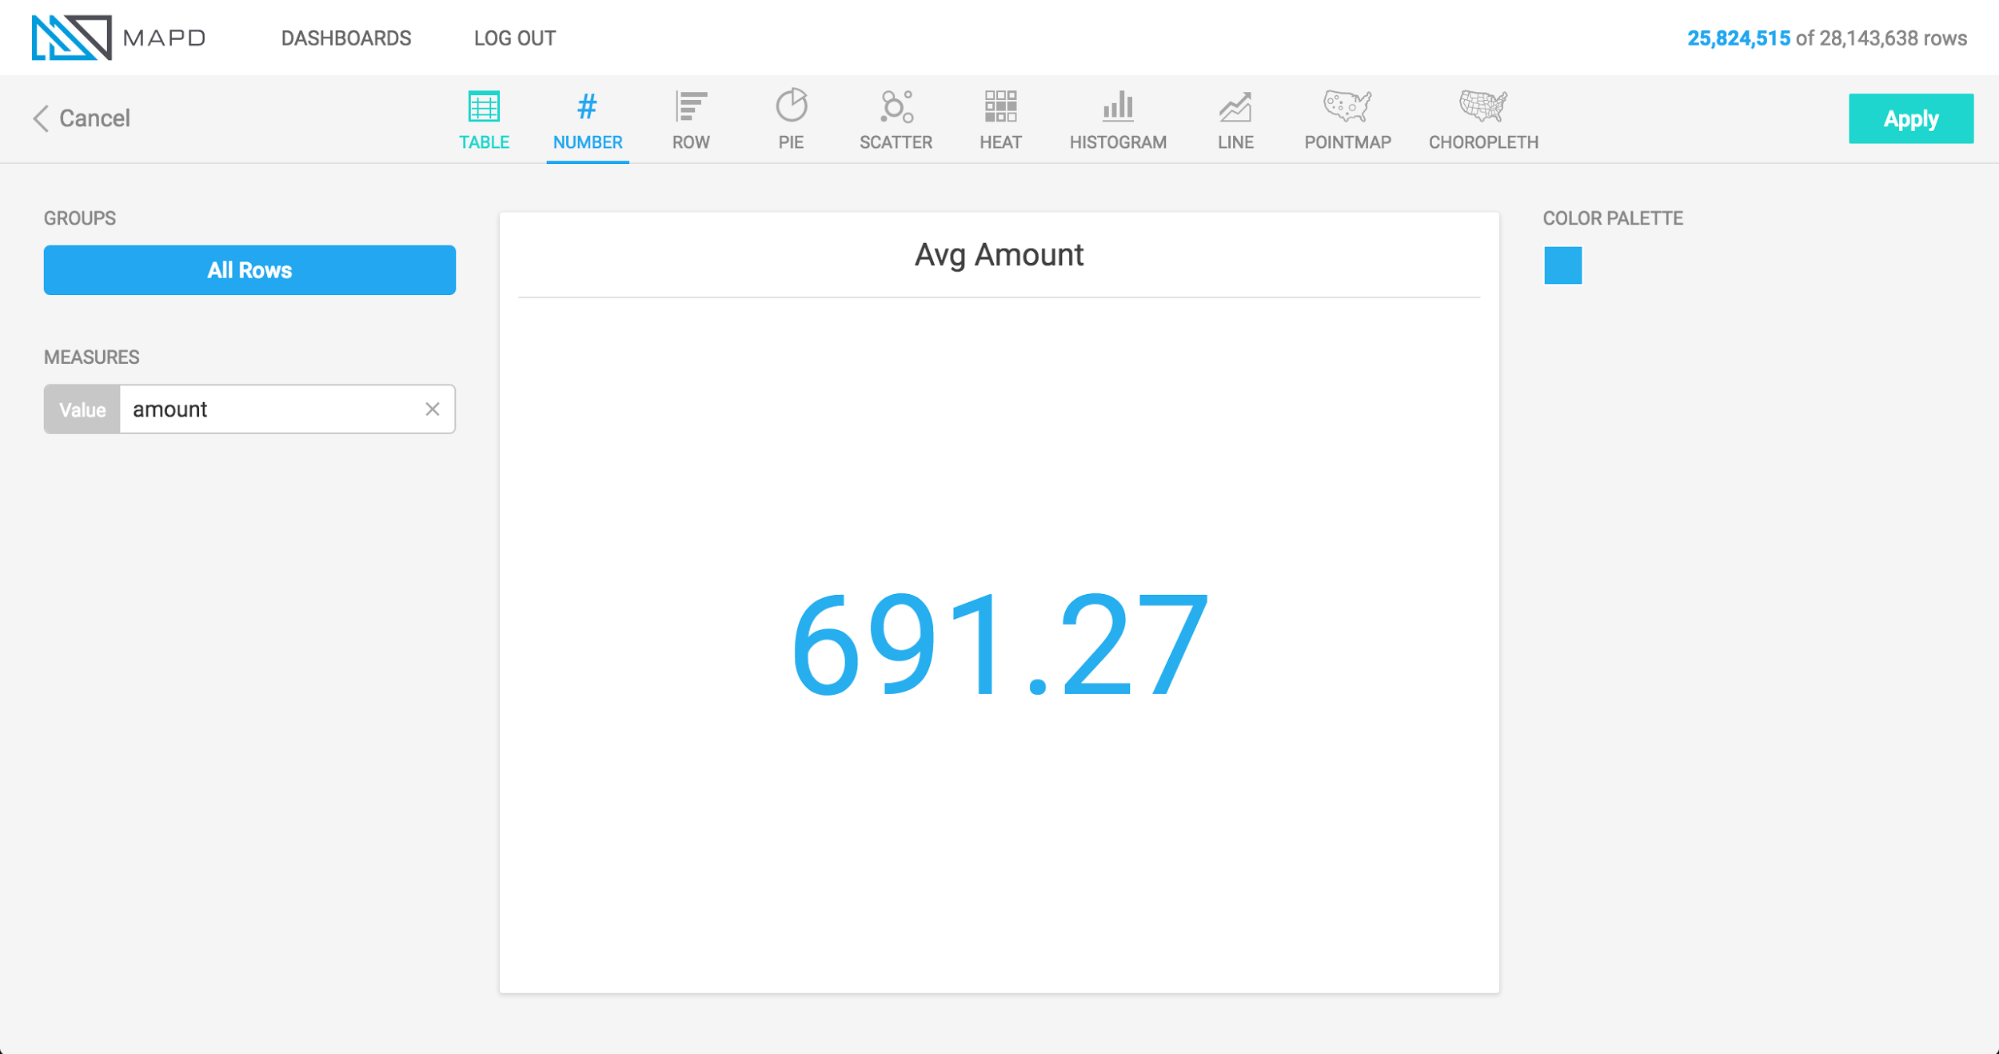
The Number Chart is a single aggregate value with no dimensions. For
example, in the image above, the value is the average of an entire column
named Amount. You can aggregate Number charts by Avg, Min,
Max, Sum, Count Unique (for string or smallint data
types), or Custom (where you can apply any SQL compatible custom
function; see Custom Measures).
When to use it
Use a number chart when you want a compact display of one
metric and are not interested in breaking out that metric by time,
category, or some other dimension. You can add multiple number charts
to a dashboard to concurrently view several aggregate calculations. For
example, viewing the Max, Min, Avg, and Sum of a
column all at once.
How to set it up
Since the Number Chart has no dimension, specify the column to be aggregated, and choose the aggregation type.