Table Chart
Table charts display raw data in rows and columns.
| Features | Quantity | Notes |
|---|---|---|
| Required Dimensions | 0 | No dimensions required. |
| Required Measures | 1 | No limit. |
| Null Dimensions | NA | Choose whether to display null dimensions. Default is true. |
You can display individual data rows, or use grouping or aggregation. There is no limit on measures for Table charts. You can view more aggregated measures in a table chart than most other chart types.
Table Chart Examples
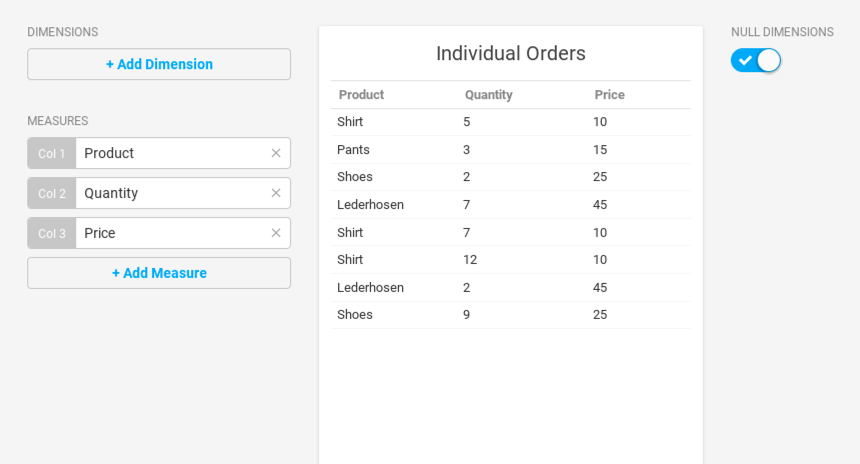
These examples use a small dataset of product orders. You can create a Table chart with using only measures to display all orders individually.
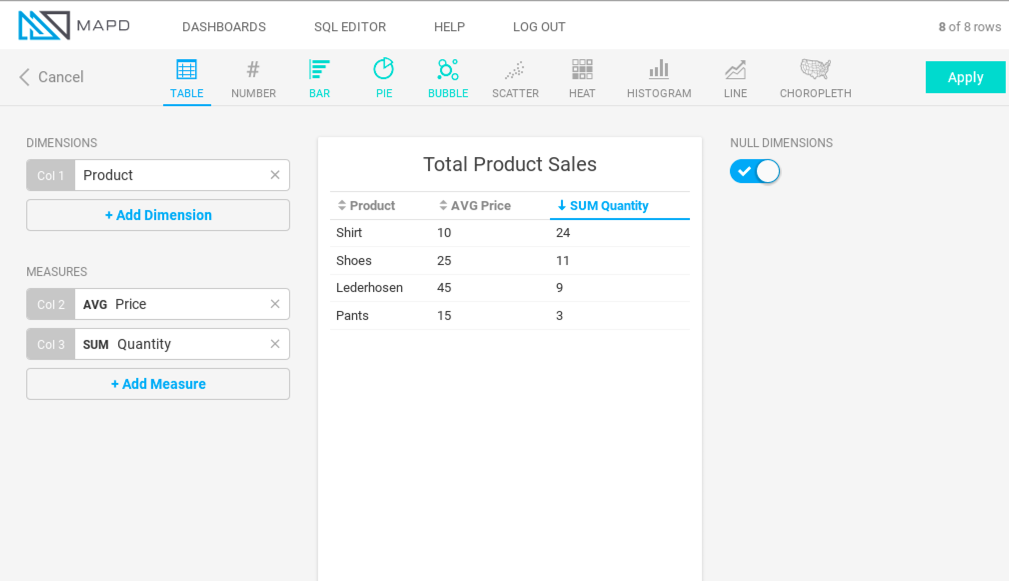
You can also use Table charts to group information by a dimension, similar to other chart types. For example, change the Product measure to a dimension, and you can sum the quantity for each product. In a grouped chart, you can sort on any column in ascending or descending order.
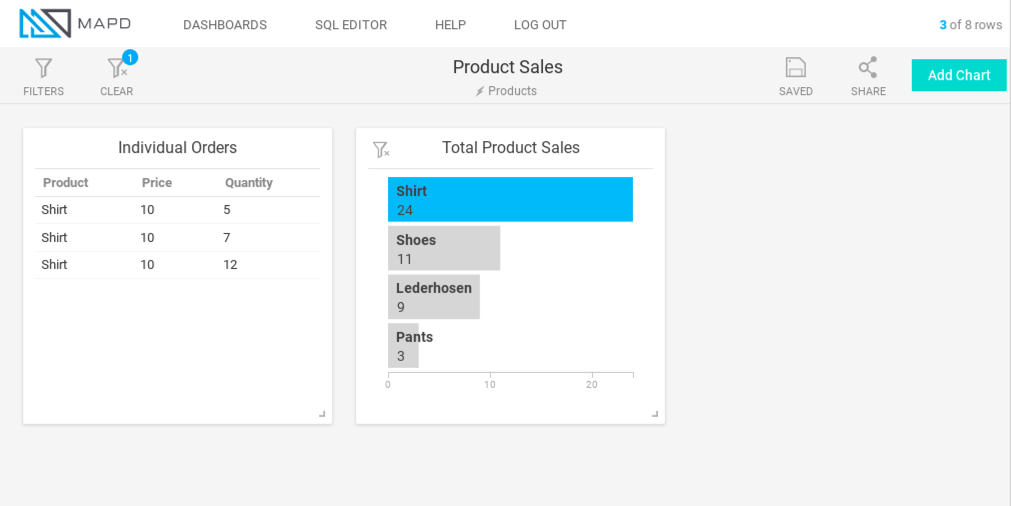
On a dashboard, you can click a dimension in a separate chart to show detailed records for that dimension in a Table chart.