Geo Heatmap
The Geo Heatmap displays aggregate values by geographic location.
| Features | Quantity | Notes |
|---|---|---|
| Required Dimensions | 2 | Requires Latitude and Longitude. |
| Required Measures | 1 | Measure 1 = color range. |
The Geo Heatmap lets you visually compare information by region.
Geo Heatmap Examples
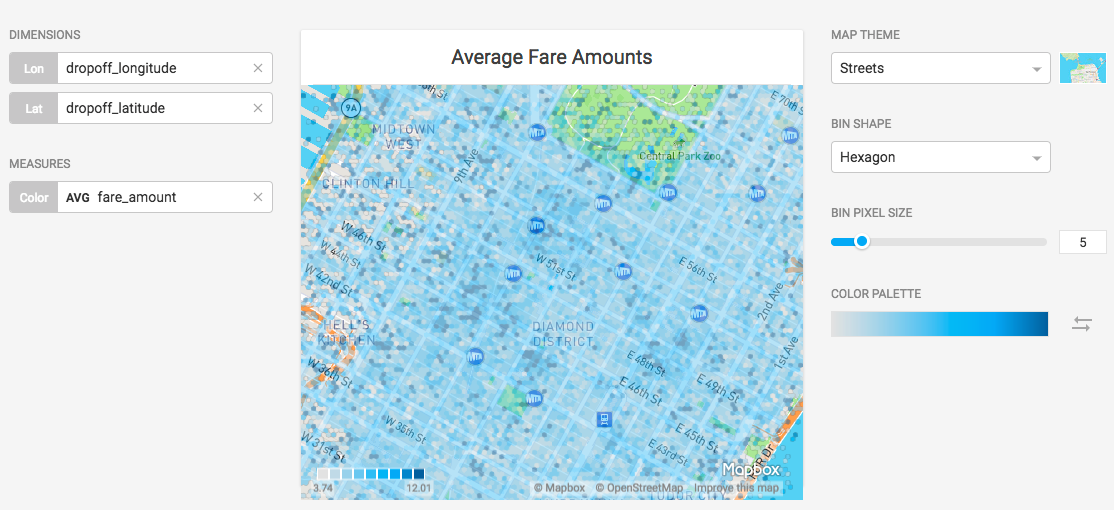
This example uses the 1 Million Row NYC Taxi database. The dimensions are set to dropoff_longitude and dropoff_latitude. The measure is set to AVG fare_amount.
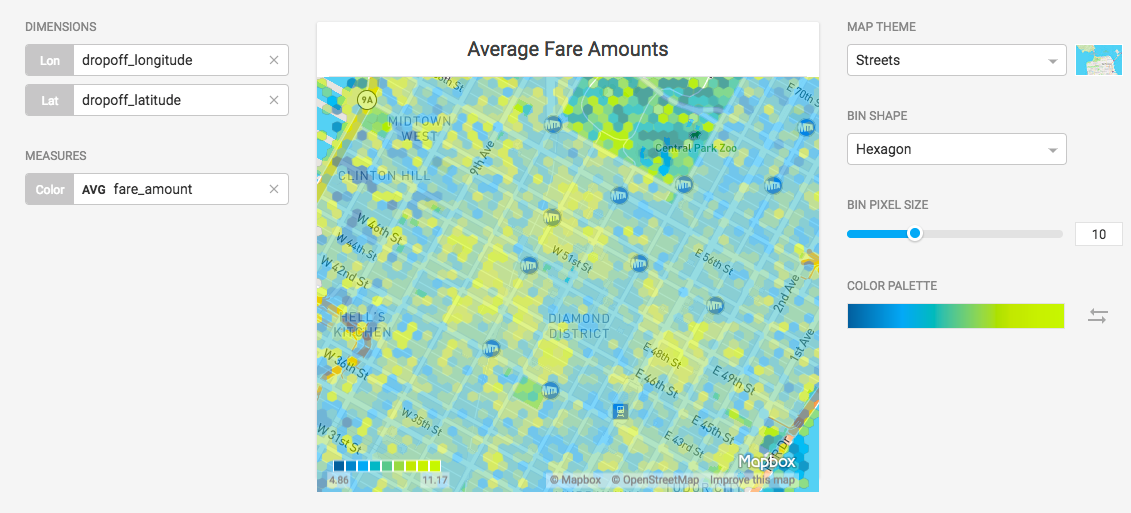
Changing the Map Theme from Light to Streets improves the contrast for the street names.
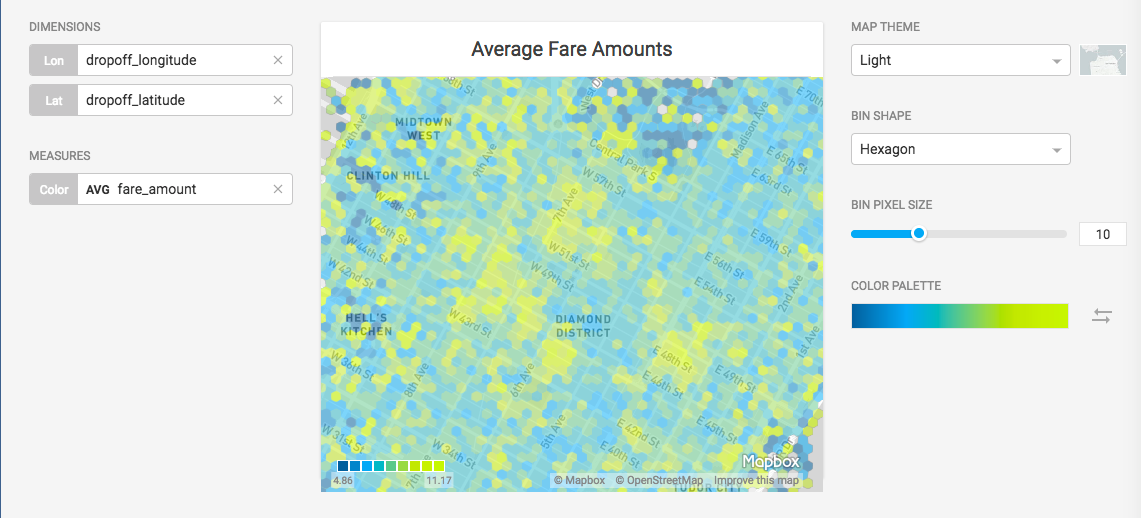
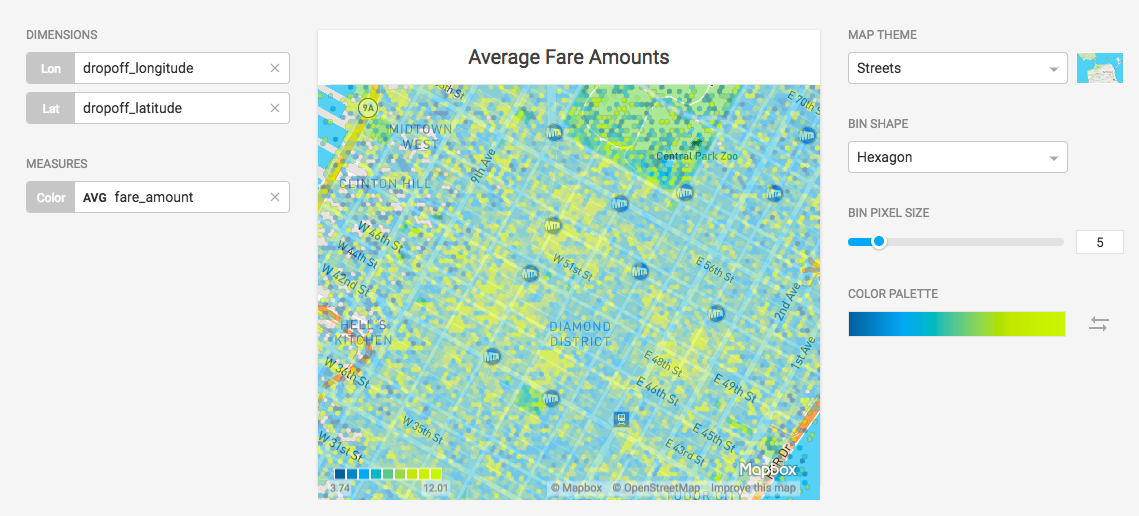
The values displayed on the Geo Heatmap are binned aggregate values. You can choose to display the Bin Shape as hexagons or as squares. You can adjust the Bin Pixel Size of the markers to a smaller size to increase the granularity of the Geo Heatmap.
You can set the Color Palette to tell a more effective story with your data. In this example, setting the palette to gradations of blue helps to distinguish between the trees in Central Park versus the fare values.