Heatmap
What it is
The Heatmap displays information in a two-dimensional grid of cells, with each cell representing a grouping of data. Color indicates the relative value cells, shifting from one end of a spectrum for lower values, to the other end of a spectrum for higher values.
When to use it
Use a Heatmap to compare the relative values of groups. Heatmaps are ideal for spotting outliers, which show up vividly on the color spectrum. They work best when the number of groupings is not too large, since large numbers of groupings cause the heatmap to exceed the viewport, making comparison harder (for such scenarios, consider using a scatterplot).
How to set it up
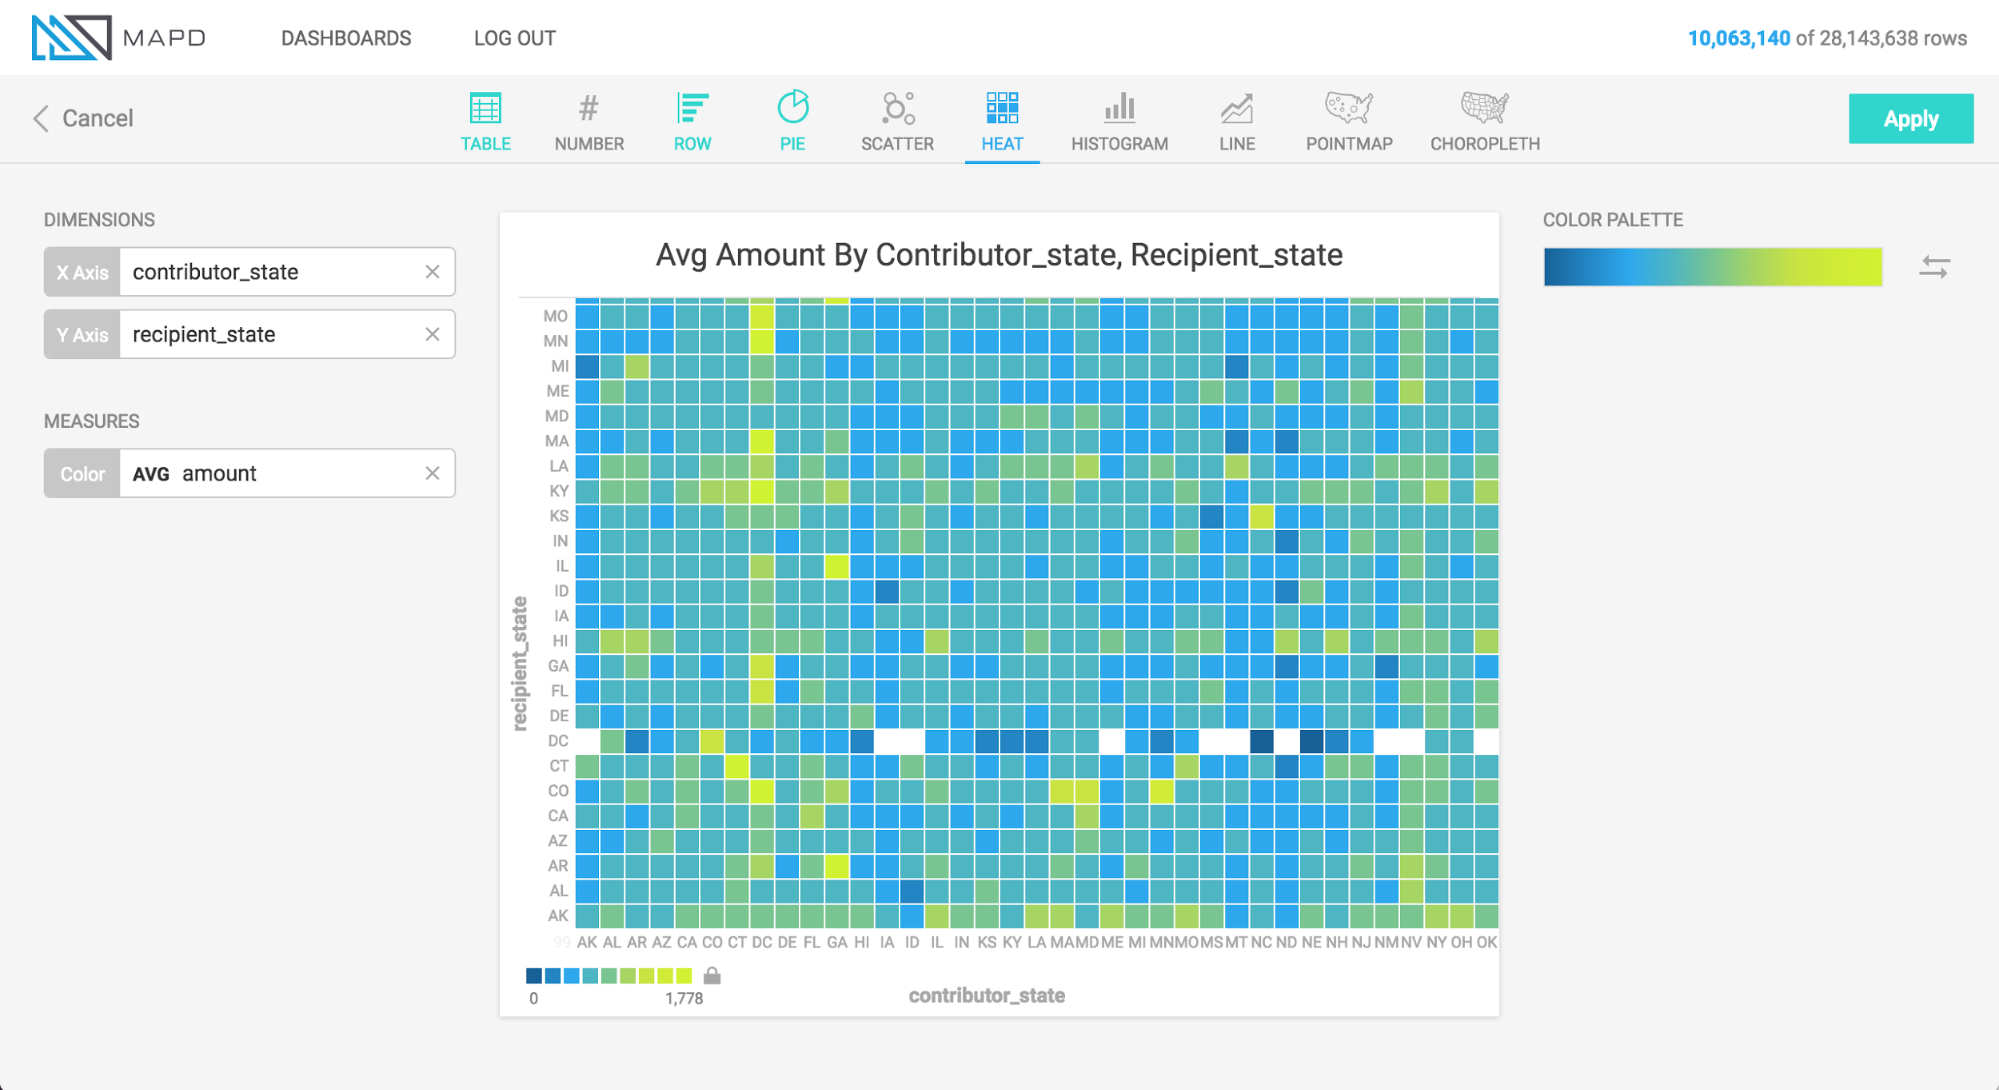
The animation below uses a political contributions dataset to create a histogram of average donation amount, broken out by contributor state and recipient state. During setup of the chart, the minimum and maximum of the color scale are tuned to give a clearer visualization.