Creating a Dashboard
You can construct a MapD Immerse dashboard following these steps:
- Start a New Dashboard
- Add One or More Charts
- Title and Save the Dashboard
Once you save the dashboard, you can share it with other MapD users.
Starting a New Dashboard
Connect to MapD Immerse by pointing a web browser to port 9092 on your MapD Core Database server. When you launch MapD Immerse, the landing page is a list of saved dashboards. You click New Dashboard in the upper right to configure a custom dashboard.
Adding a chart
To add a chart, you click Add Chart, choose a chart type, set dimensions and measures, then click Apply. For more information on creating charts, see creating-a-chart and MapD Immerse Chart Types.
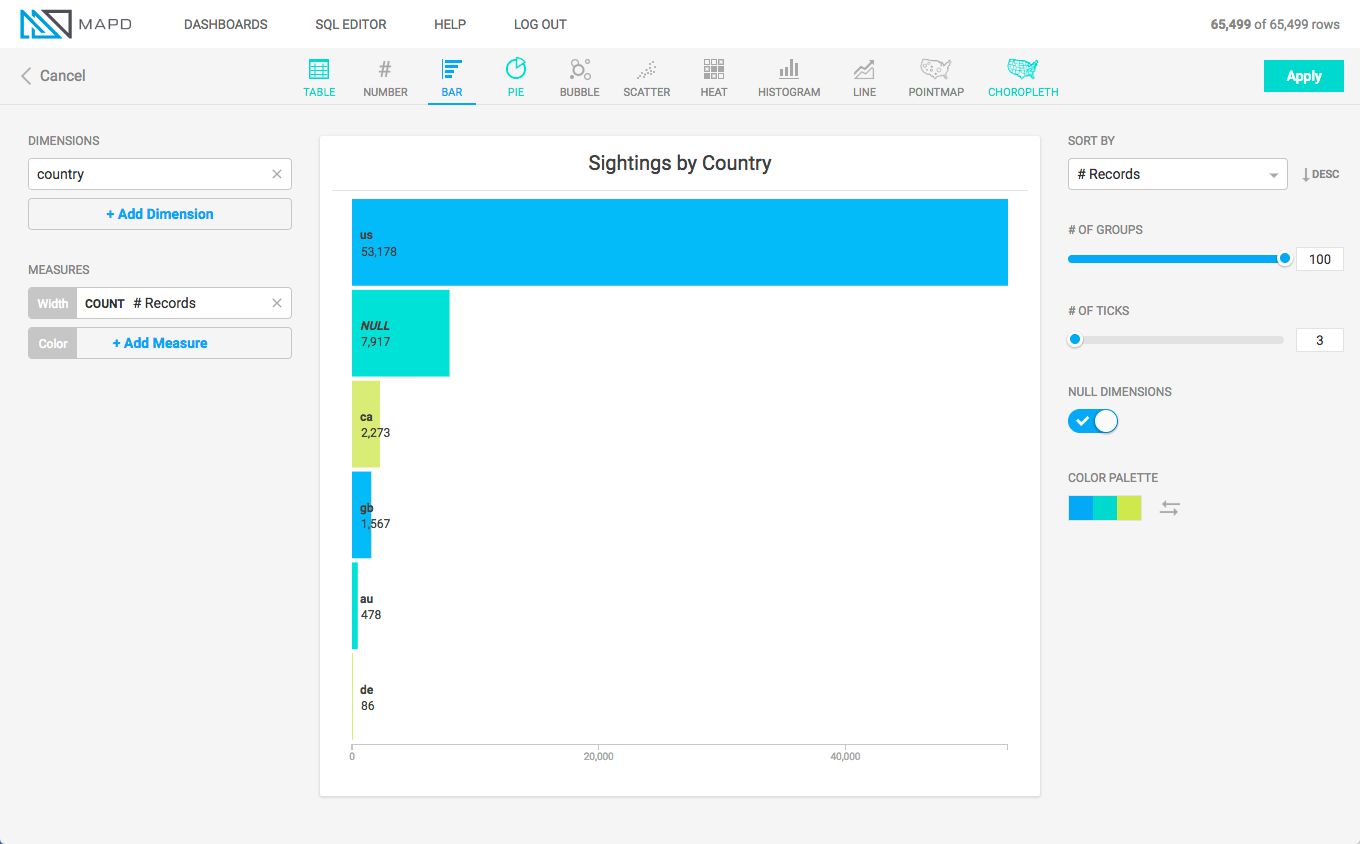
To create a chart:
- Click Add Chart.
- Choose a Data Source. For example, UFO_Sightings.
- Choose a chart type. For example, Bar.
- Set the Dimension. For example, country.
- Set the Measure. For example, COUNT # Records.
- Click Apply.
Moving/resizing charts
To move a chart within a dashboard, click the title bar and drag the chart to the new location. If there is already at that location, it moves aside.
To resize the chart, click on the lower right corner of the chart and drag to change the size.
Cross-filtering
When you add more than one chart to a dashboard, filters on one chart affect all other charts on the dashboard.
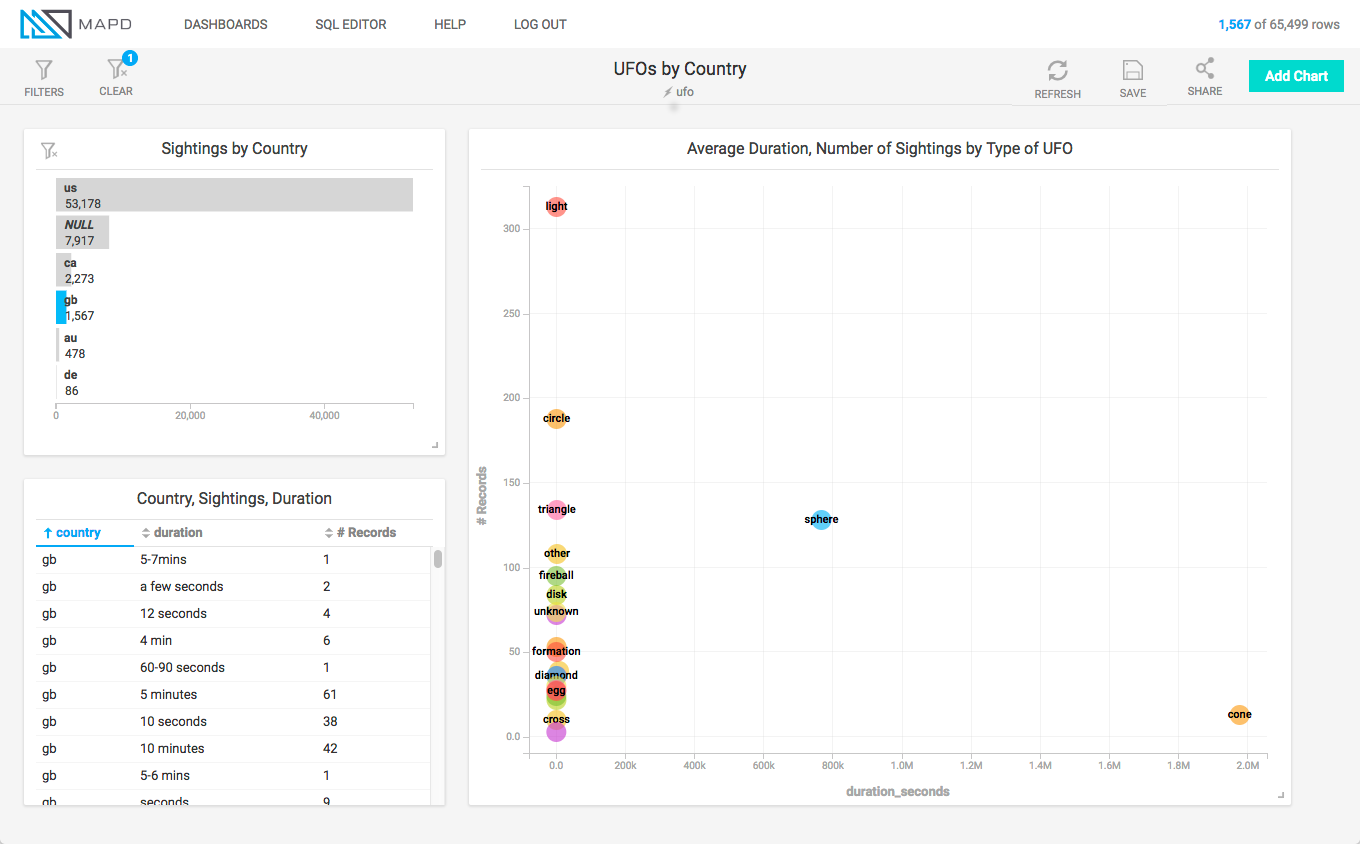
For example, the dashboard below shows UFO Sightings in various countries.
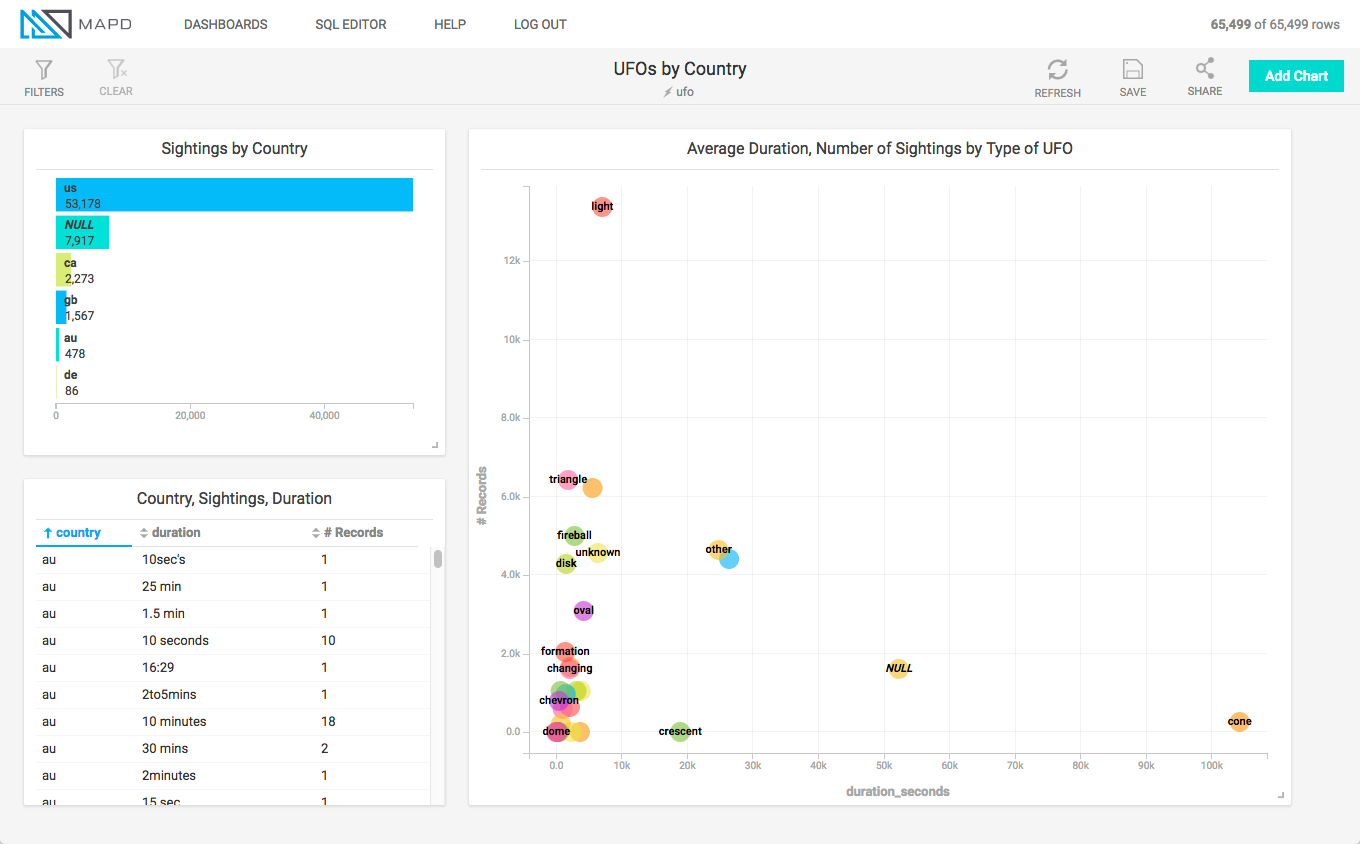
If you click the bar for Great Britain (gb) on the “Sightings by Country” chart, the other charts are filtered, as well.
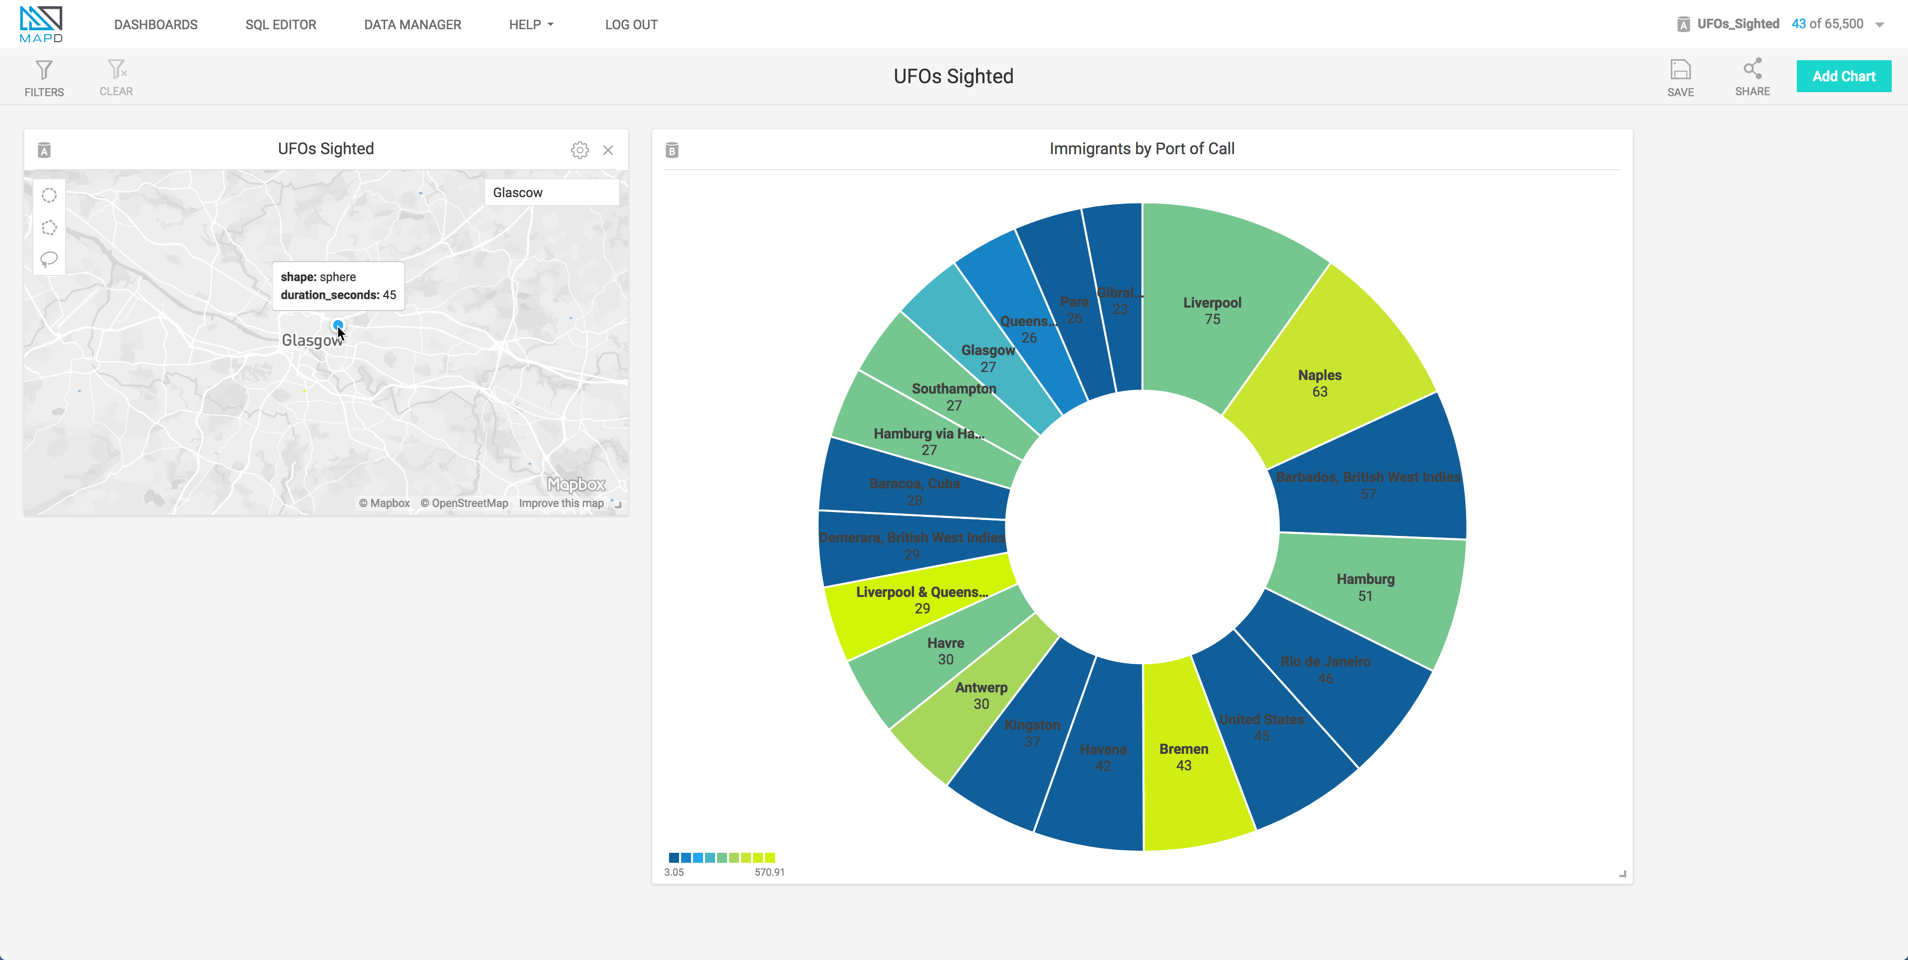
Multi-source Dashboards
You can choose different data sources for individual charts on your dashboard. This lets you look for visual correlations in datasets that are not directly connected.
For example, this charts compare immigration rates to UFO sightings. Glascow looks suspicious.
Refreshing a Dashboard
If you update your dataset, you can redraw your chart using the Refresh icon.
- Click Refresh.
- Choose Refresh Now.
If you have streaming data continually updating your dataset, you can set an interval to automatically refresh your dashboard.
- Click Refresh.
- Click Auto Refresh.
- Choose an interval (for example, 2 Minutes).
To turn off Auto Refresh, set the interval to Off.
Titling and Saving a Dashboard
To title and save a dashboard:
- Click the title area.
- Type a title.
- Click Save.
Sharing a Dashboard
To share a dashboard URL:
- Click Share.
- In the Share Link box, click the copy icon.
- Paste the URL into a message or online resource.
Exporting and Importing a Dashboard Definition
You can use mapdql to export a dashboard definition as a JSON file, then import the dashboard definition to another MapD instance.
To export a dashboard definition:
Start mapdql.
Enter the following backslash command:
\export_dashboard <dashboard-name>, <file-path>
Where
<dashboard-name>is the name of the dashboard in Immerse and<file-path>is the name and location to create the JSON file.For example:
\export_dashboard my_dashboard,/mapd/my_dashboard.json
To import a dashboard definition:
Copy the export file to a location available to another MapD instance.
Enter the following backslash command.
\import_dashboard <dashboard-name>,<file-path>
Where
<file-path>is the location and name of a file exported from another MapD instance.For example:
\import_dashboard another_dashboard,/mapd/my_dashboard.json
Deleting a Dashboard
To delete a dashboard:
- Click Dashboards.
- Mouse over the dashboard you want to delete.
- Click X at the end of the dashboard row.