Docker CE GPU Installation Recipe
These are the steps to installing MapD Community Edition as a Docker container on a machine running with NVIDIA Kepler or Pascal series GPU cards.
Here is a quick video overview of the installation process.
Install Docker and nvidia-docker.
Note: nvidia-docker has a dependency on nvidia-modprobe. If you receive the message: Error: Could not load UVM kernel module. Is nvidia-modprobe installed? you can install nvidia-modprobe using the following commands.
sudo apt-add-repository multiverse
sudo apt update
sudo apt install nvidia-modprobe
NVIDIA-docker now defaults to using the latest version of nvidia-docker2. To use nvidia-docker2, open a new terminal window and enter the following command:
docker run --runtime=nvidia \
-v $HOME/mapd-docker-storage:/mapd-storage \
-p 9090-9092:9090-9092 \
mapd/mapd-ce-cuda
If you are using nvidia-docker version 1, run the following command.
nvidia-docker run -d \
-v $HOME/mapd-docker-storage:/mapd-storage \
-p 9090-9092:9090-9092 \
mapd/mapd-ce-cuda
Note: As of this writing, NVIDIA provides a wrapper that falls back to version 1 if you execute the nvidia-docker2 command. There is no guarantee for long-term maintenance of that wrapper. For more information, see Docker Engine Utility for NVIDIA GPUs.
When the installation is complete, Docker runs the MapD server and MapD web server automatically.
Command Line Access
You can access the command line in the Docker image to perform configuration and run MapD utilities.
You need to know the container-id to access the command line. Use the command below to list the running containers.
docker container ls
You see output similar to the following.
CONTAINER ID        IMAGE               COMMAND                  CREATED             STATUS              PORTS                                            NAMES
9e01e520c30c        mapd/mapd-ce-gpu    "/bin/sh -c '/mapd..."   3 days ago          Up 3 days           0.0.0.0:9090-9092->9090-9092/tcp                 confident_neumann
Checkpoint
To verify that all systems are go, load some sample data, perform a mapdql query, and generate a pointmap using Immerse.
MapD ships with two sample datasets of airline flight information collected in 2008, and one dataset of New York City census information collected in 2015. To install the sample data, run the following command.
docker exec -it <container-id> /mapd/insert_sample_data
Where <container-id> is the container in which MapD is running.
When prompted, choose whether to insert dataset 1 (7,000,000 rows), dataset 2 (10,000 rows), or dataset 3 (683,000 rows). The examples below use dataset 2.
Enter dataset number to download, or 'q' to quit:
#     Dataset                   Rows    Table Name             File Name
1)    Flights (2008)            7M      flights_2008_7M        flights_2008_7M.tar.gz
2)    Flights (2008)            10k     flights_2008_10k       flights_2008_10k.tar.gz
3)    NYC Tree Census (2015)    683k    nyc_trees_2015_683k    nyc_trees_2015_683k.tar.gz
Connect to MapD Core by entering the following command (default password is HyperInteractive):
docker exec -it <container-id> /mapd/bin/mapdql
password: ••••••••••••••••
Enter a SQL query such as the following:
mapdql> SELECT origin_city AS "Origin", dest_city AS "Destination", AVG(airtime) AS
"Average Airtime" FROM flights_2008_10k WHERE distance < 175 GROUP BY origin_city,
dest_city;
The results should be similar to the results below.
Origin|Destination|Average Airtime
Austin|Houston|33.055556
Norfolk|Baltimore|36.071429
Ft. Myers|Orlando|28.666667
Orlando|Ft. Myers|32.583333
Houston|Austin|29.611111
Baltimore|Norfolk|31.714286
Connect to Immerse using a web browser connected to your host machine on port 9092. For example, http://localhost:9092.
Create a new dashboard and a Scatter Plot to verify that backend rendering is working.
- Click New Dashboard.
- Click Add Chart.
- Click SCATTER.
- Click Add Data Source.
- Choose the flights_2008_10k table as the data source.
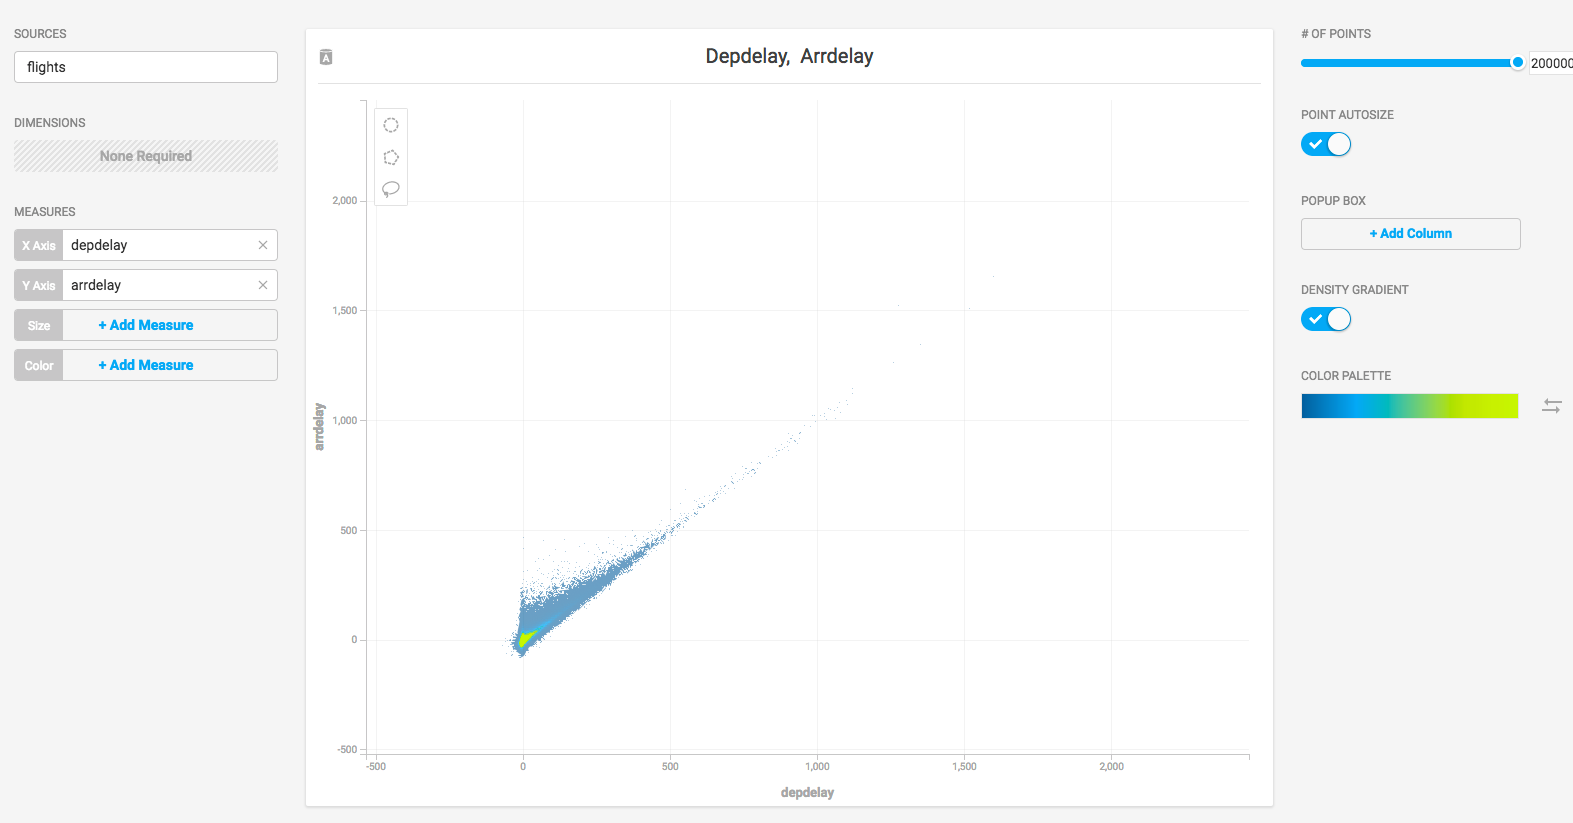
- Click X Axis +Add Measure.
- Choose depdelay.
- Click Y Axis +Add Measure.
- Choose arrdelay.
The resulting chart shows, unsurprisingly, that there is a correlation between departure delay and arrival delay.