Number Chart
The Number chart displays a single aggregate measure with no dimensions.
| Features | Quantity | Notes |
|---|---|---|
| Required Measures | 1 | Measure 1 = color range. |
Specify a measure and aggregation to create your Number chart.
Number Chart Examples
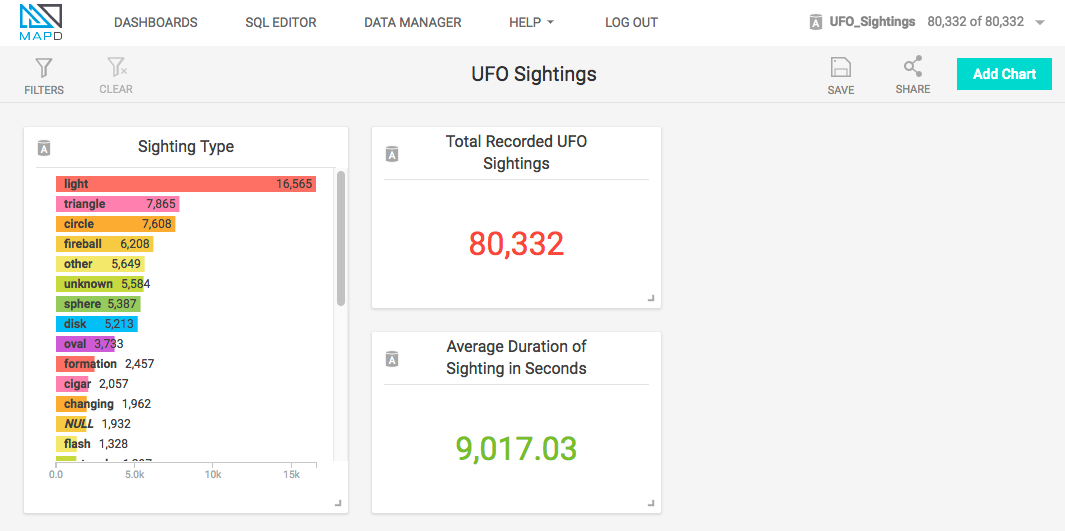
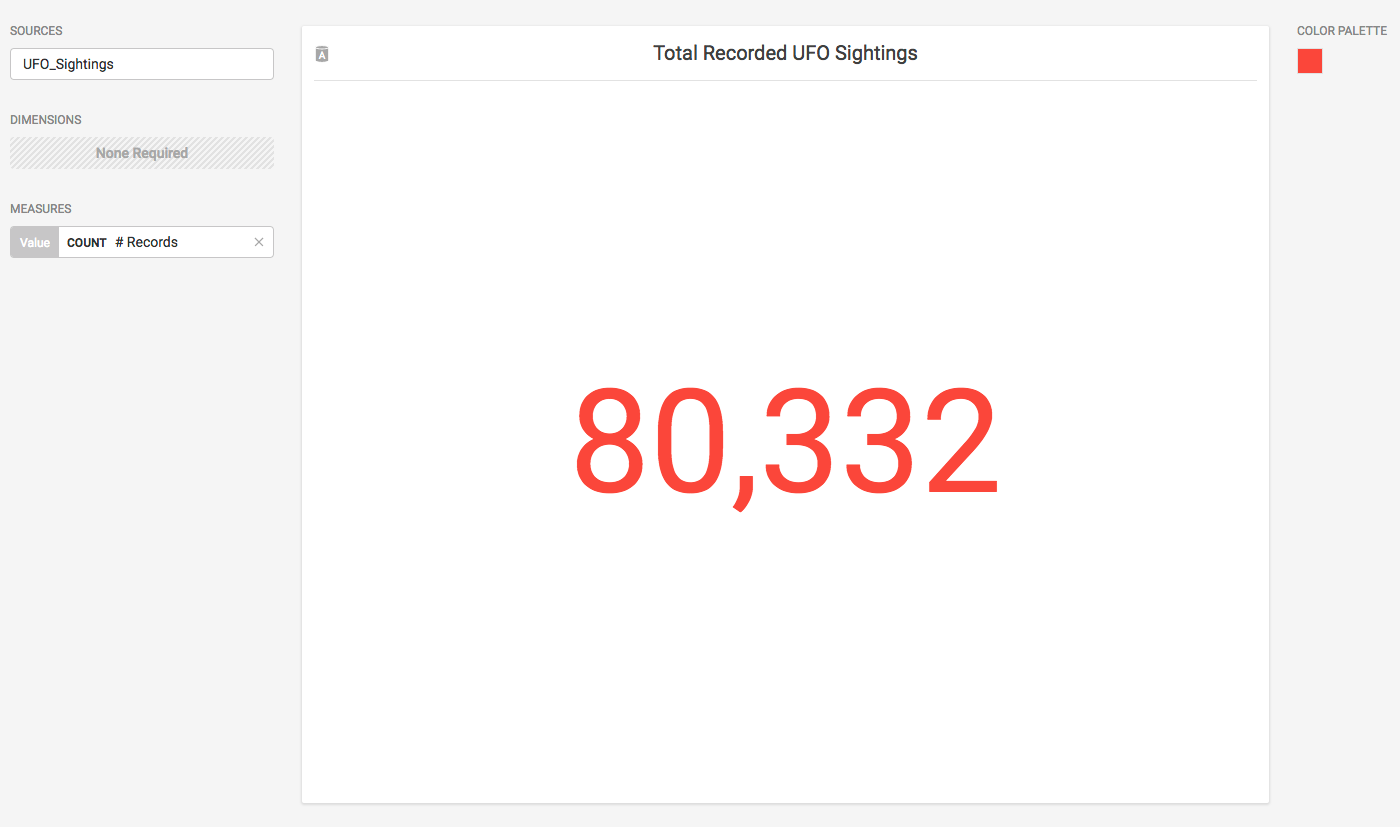
Choose a Data Source. This example uses the official database of UFO sightings.
Choose an aggregate measure to display, and give the chart a title.
You can use a Number chart for dramatic impact, or to monitor a specific, important aggregate value from a dataset. You can use it to add emphasis to an important value in another chart on the dashboard.
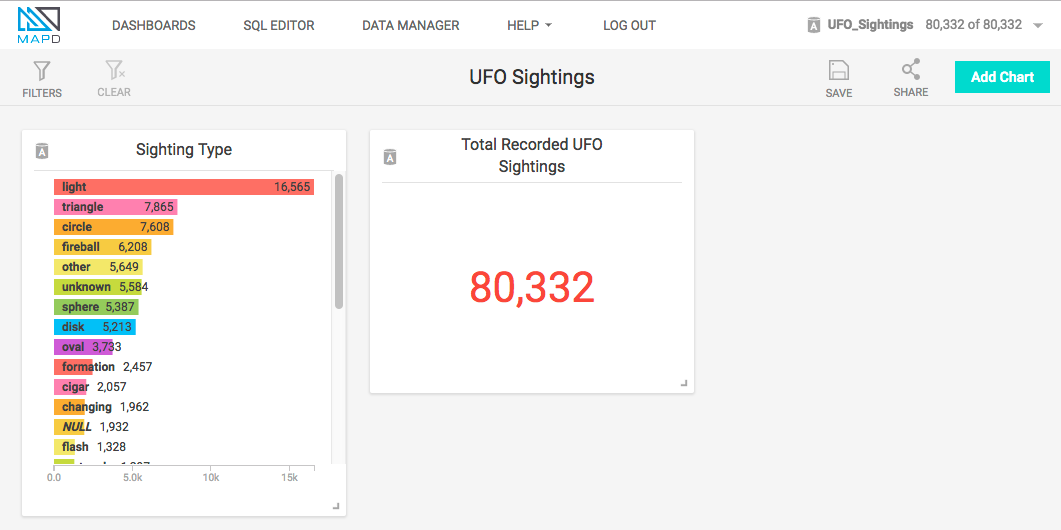
You can use multiple Number charts on the same dashboard to show several aggregate values at once.