
Using servers.json to Configure Immerse Options
This topic describes how to use the servers.json file to define the default connection behavior in OmniSci Immerse. It describes how to enable default behavior using servers.json, provides basic syntax, and includes examples. You can define the OmniSci database to connect to, as well as the username and password. You can also configure Immerse to use additional tile sources for geo charts.
- Editing omnisci.conf to Enable servers.json
- servers.json File Properties
- Configuring Data Source and User Login Credentials
- Enable Custom Styles
- Full
servers.jsonExample - Enable Custom Basemap Styles for Geo Charts
Editing omnisci.conf to Enable servers.json
To enable default behavior through a servers.json file, you must first edit omnisci.conf to include servers.json information:
- In your OMNISCI_STORAGE directory, open
omnisci.conf. For information aboutomnisci.confand available options, see Configuration File. - In the
[web]section ofomnisci.conf, referenceservers.jsonby adding the following line:
servers-json = "<OMNISCI_STORAGE>/servers.json"
Replace <OMNISCI_STORAGE> with the full path to servers.json.
- Save
omnisci.conf.
servers.json File Properties
| Property | Description | ||
|---|---|---|---|
"database": "<database_name>" |
The name of the database that Immerse connects to by default. | ||
"host": "<hostname>" |
Name of the database host. | ||
"loadDashboard": "<dashboardID>" |
ID number of the Immerse dashboard to load on login. | ||
"login_panel_databases" : [ "database_1", "database_2", "database_3" ] |
Dropdown menu of databases to select at login.
| ||
"password": "<password>" |
Immerse user password. | ||
"port": "<port_number>" |
Port used for connecting to the database host. | ||
"protocol": "<protocol>" |
Connection protocol to use: http or https. |
||
"url": "<URL>" |
Universal resource locator. Defines the path to the source database. Can be used as an alternative to identifying host and protocol. | ||
"username": "<username>" |
Name of the Immerse user. | ||
"offline": "true" |
Set to "true" to help Immerse identify an offline environment and show a basemap (countries boundary geojson polygons) for Geo charts.Otherwise, Immerse shows Mapbox basemaps and any custom basemaps you have defined. | ||
"customStyles": "<[options]>" |
Productize Immerse by customizing colors, login text, logo, and other UI elements. For more information, see Enable Custom Styles. | ||
"mapboxCustomStyles": "<[options]>" |
Specify and use basemap styles other than those provided with Immerse. For more information, see Enable Custom Basemap Styles for Geo Charts. |
Configuring Data Source and User Login Credentials
You can create a servers.json file to control the default configuration when you log in to OmniSci Immerse. The information in servers.json can identify the database you connect to and credentials to use during automatic login.
- If
servers.jsondoes not exist yet, create a file by that name in the OMNISCI_STORAGE directory. - In
servers.json, specify the database to connect to, as well as username and password information. You can use host, port, and protocol to specify the path to the data:
[
   {
          "database": "<database_name>",
          "port": "<port_number>",
          "host": "<hostname>",
          "protocol": "<protocol>",
          "username": "<username>",
          "password": "<password>"
        }
]
Alternatively, you can define the data source using a URL:
[
   {
          "database": "<database_name>",
          "url": "<URL>",
          "username": "<username>",
          "password": "<password>"
        }
]- Save
servers.json.
| Note |
|
Feature Flags
The feature_flags section lets you set global default settings for the Immerse UI.
| Element | Description |
|---|---|
enableDataCatalog |
Use this flag to control whether the Data Catalog is enabled in Immerse. The value is true by default. Set the value to false to disable and hide the Data Catalog. |
ui/default_theme |
Use this flag to set the default Immerse theme for all users.
If a user has defined their own theme, that theme is used for that user's instance. If a user has not specified a theme, but the default theme is set in servers.json, that default theme is used. If no default theme is set, the system default is dark mode. |
ui/enable_unrestricted_percentage_view_pie_chart |
By default, Pie chart percentage labels and All Others slice options can only be toggled on for a # Records or SUM() aggregate. Set this flag to true to allow percentage labels to be toggled on or off for any aggregate value in a Pie chart. |
Enable Custom Styles
To productize OmniSci Immerse, you can add the customStyles JSON object to servers.json. Use the customStyles elements to:
- Customize colors
- Customize the text displayed in the browser tab
- Add your own logo
- Customize the login text
- Disable the Help menu dropdown on the navigation bar
| Element | Description |
|---|---|
buttonPrimaryColor |
Button color when inactive |
buttonSecondaryHighlightColor |
Button color when hovering. |
colors |
Hexadecimal color definitions used in charts. |
custom |
Custom colors, requires 11 or more colors. These are the options available in the Color by Dimension pop-up. |
disableHelpMenu |
Set to true to disable Help dropdown on the navigation bar. |
loginText |
Specify custom text for the Immerse login page. |
logoURL | URL to your logo. This must be a browser-accessible http(s) URL, not a file system path. |
ordinal |
4 scales, 1 or more colors each scale. Defines a range of colors that measures iterate through repeatedly. The size of the range can vary. |
quantitative |
4 scales, 1 or more colors each scale. Quantitative measures produce smooth, continuous gradients between each "stopping point" defined in the list of colors, in order. |
secondaryButtonColor |
Button color when pressed. |
solid |
Solid colors, requires 8 or more colors. All measures are assigned one color. The array of colors you provide defines which colors are available. |
title |
Text displayed in the browser tab. |
Notes
- There are no visual design guarantees when using a large number of colors. For example, visual elements might bleed beyond borders or have an unexpected layout.
- Custom styles do not affect the settings for charts or dashboards saved before the custom styles are defined. However, you can edit existing charts and replace the colors in use to colors in your custom palette.
Full servers.json Example
The following example shows a complete servers.json file that includes customization. When you want to change any of the settings in servers.json, you must replace all settings in servers.json, even if you duplicate the default values.
[
{
   "database": "omnisci",
   "url": "localhost",
   "port": "6273",
   "username": "admin",
   "password": "HyperInteractive",
   "feature_flags": {
      "ui/default_theme": "light"
   },
   "customStyles": {
      "logoURL": "http://www.omnisci.com/docs/latest/images/3_panda.png",
      "loginText": "Log in to Panda Bear Wear Ware",
      "title": "Where Panda Bear Wear Ware Wearers Dare Care",
      "buttonPrimaryColor": "#888888",
      "buttonSecondaryColor": "#444444",
      "buttonSecondaryHighlightColor": "#000000",
      "colors": {
        "solid": [
           "#333333",
           "#555555",
           "#777777",
           "#999999",
           "#aaaaaa",
           "#cccccc",
           "#eeeeee",
           "#ffffff"
        ],
        "custom": [
           "#000000",
           "#eeeeee",
           "#222222",
           "#cccccc",
           "#444444",
           "#bbbbbb",
           "#666666",
           "#aaaaaa",
           "#333333",
           "#dddddd",
           "#111111"
        ],
        "ordinal": [
           [
              "#111111",
              "#cccccc"
           ],
           [
              "#111111",
              "#777777",
              "#cccccc"
           ],
           [
              "#111111",
              "#555555",
              "#999999",
              "#bbbbbb",
              "#eeeeee"
           ],
           [
              "#111111",
              "#333333",
              "#555555",
              "#777777",
              "#999999",
              "#bbbbbb",
              "#dddddd",
              "#eeeeee"
           ]
        ],
        "quantitative": [
           [
              "#555555",
              "#cccccc"
           ],
           [  "#111111",
              "#eeeeee"
           ]
        ]
      }
   }
}
]
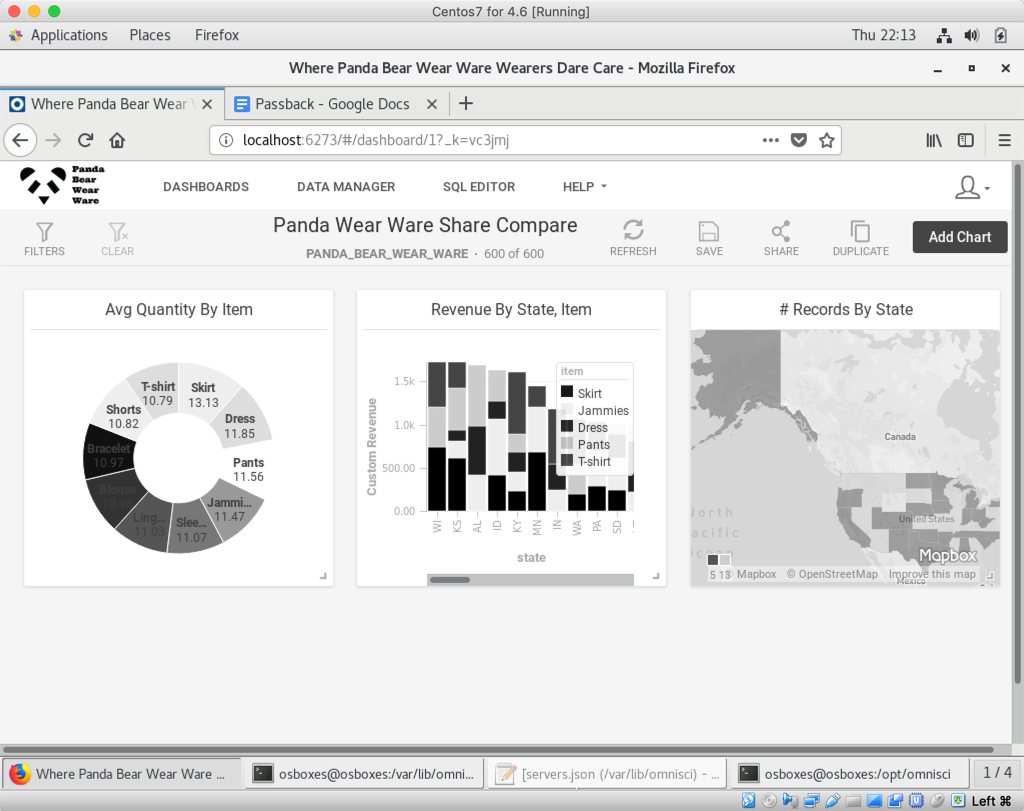
This example is for the totally not made up company Panda Bear Wear Ware, where you can find all of your Panda Bear Wear Ware in one lair with time to spare. There is an understandable predilection toward black, white and everything in between on their color palette.
The first section contains branding information for their OmniSci Immerse instance.
"logoURL": "http://www.omnisci.com/docs/latest/images/3_panda.png",
"loginText": "Log in to Panda Bear Wear Ware",
"title": "Where Panda Bear Wear Ware Wearers Dare Care",
"buttonPrimaryColor": "#888888",
"buttonSecondaryColor": "#444444",
"buttonSecondaryHighlightColor": "#000000",
The logo, labeling, and button colors are visible at the dashboard level.
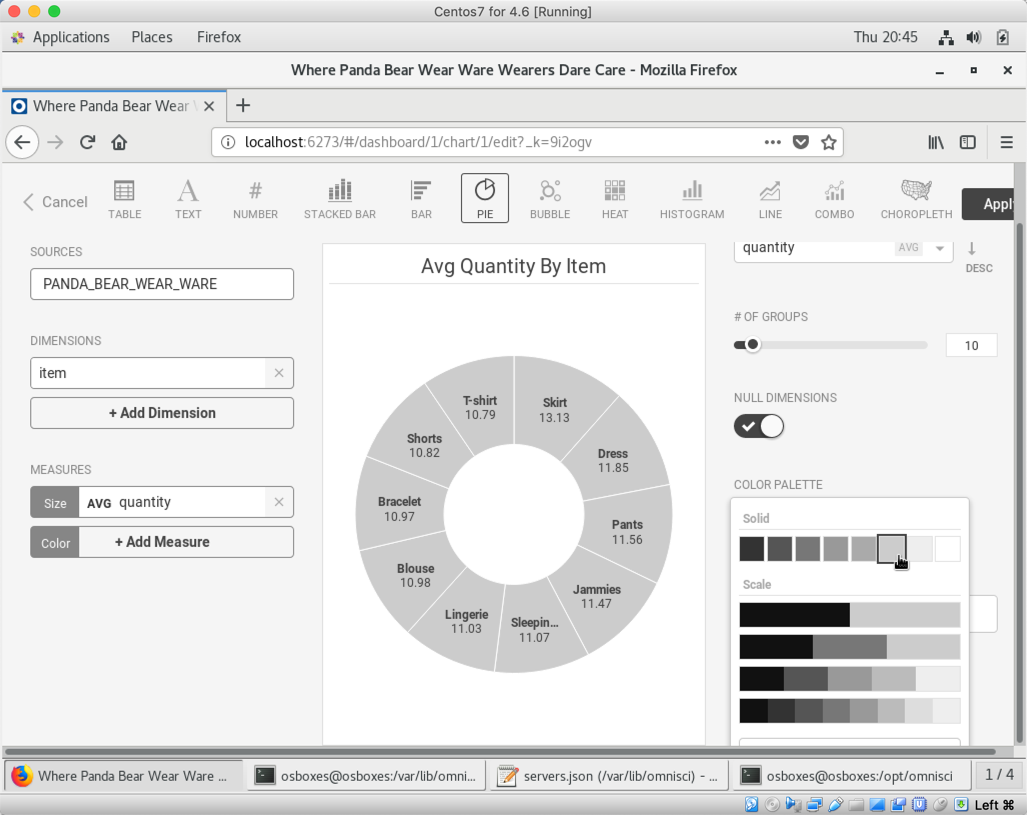
The Solid palette colors all items in Line, Pie, Bar, and other charts with one color. You can define the array of available colors.
      "colors": {
        "solid": [
           "#333333",
           "#555555",
           "#777777",
           "#999999",
           "#aaaaaa",
           "#cccccc",
           "#eeeeee",
           "#ffffff"
        ],
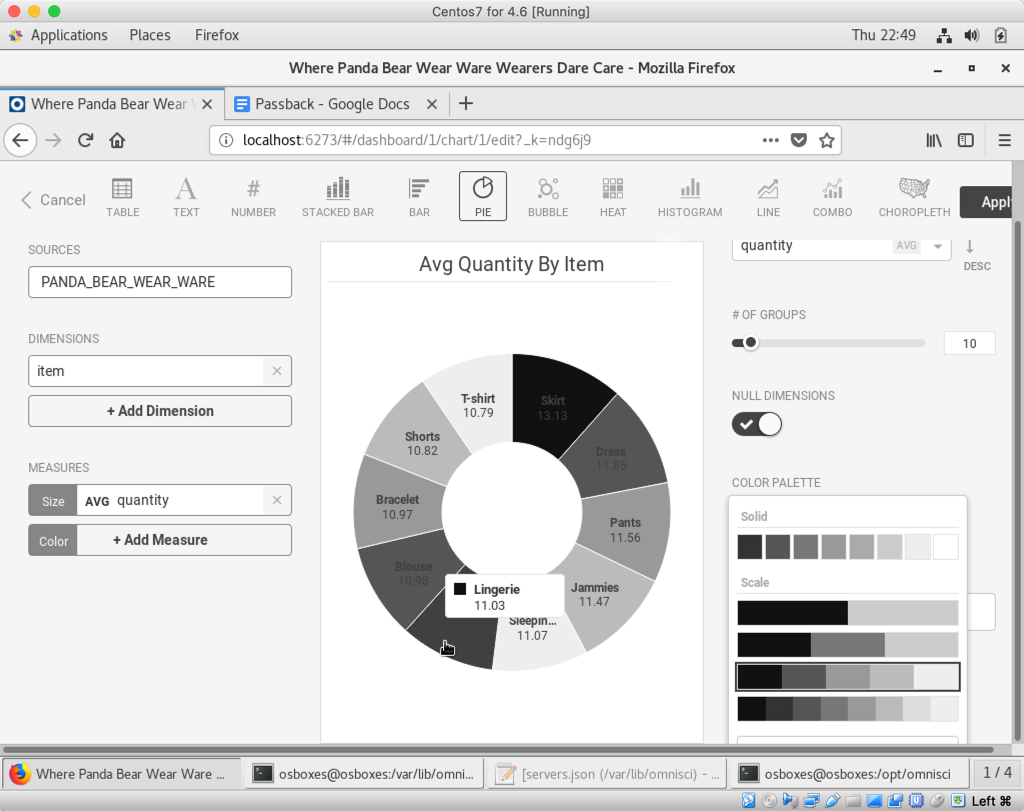
The Ordinal palette defines a range of colors that are iterated repeatedly in a chart with many values. You can define multiple ranges from which to select.
"        ordinal": [
           [
              "#111111",
              "#cccccc"
           ],
           [
              "#111111",
              "#777777",
              "#cccccc"
           ],
           [
              "#111111",
              "#555555",
              "#999999",
              "#bbbbbb",
              "#eeeeee"
           ],
           [
              "#111111",
              "#333333",
              "#555555",
              "#777777",
              "#999999",
              "#bbbbbb",
              "#dddddd",
              "#eeeeee"
           ]
        ],
For example, a Pie chart can cycle through colors on the Ordinal palette to color each segment.
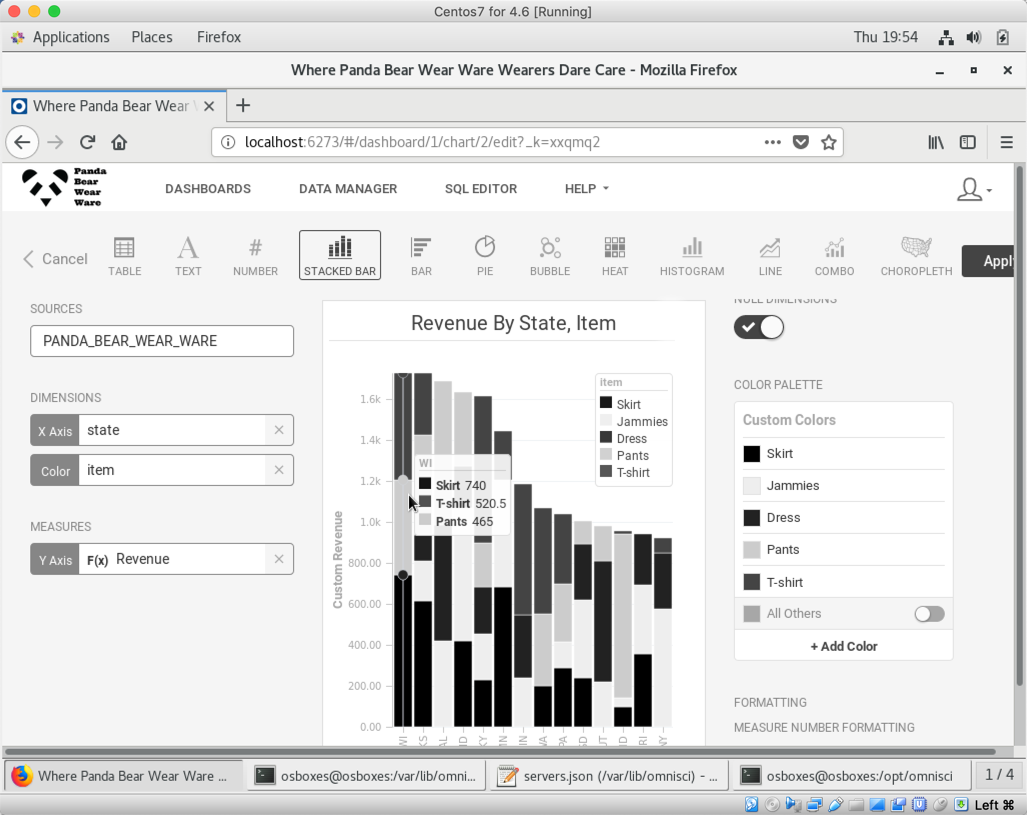
The Custom palette populates the Custom and Color By Dimension pop-ups, allowing you to assign specific colors to one or more values.
        "custom": [
           "#000000",
           "#eeeeee",
           "#222222",
           "#cccccc",
           "#444444",
           "#bbbbbb",
           "#666666",
           "#aaaaaa",
           "#333333",
           "#dddddd",
           "#111111"
        ],
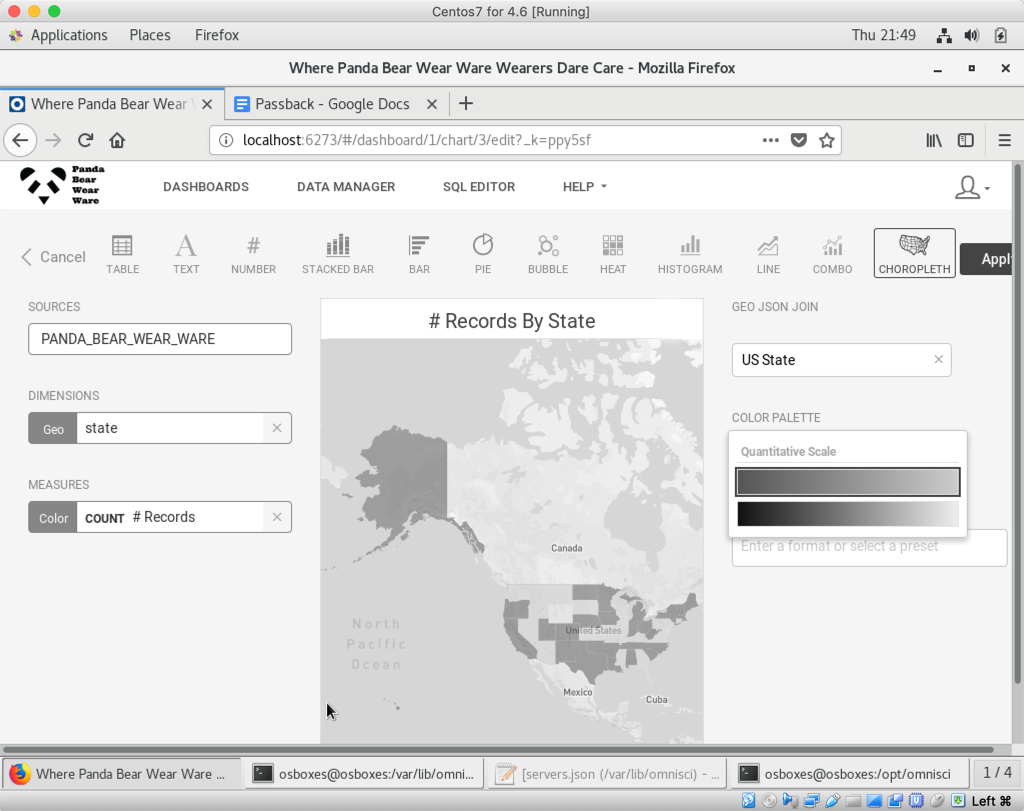
The Quantitative palette gives a range of two or more colors. Values are expressed as a gradient on a continuum between the colors you define. You can create multiple value sets.
        "quantitative": [
           [
              "#555555",
              "#cccccc"
           ],
           [  "#111111",
              "#eeeeee"
           ]
        ]
Enable Custom Basemap Styles for Geo Charts
If you work extensively with geospatial data, you might need to use basemap styles that are different than those provided by Immerse. By modifying servers.json, you can use custom map styles created with Mapbox Studio, as well as third-party OGC-compliant raster tile sources.
To use different basemap styles, add the mapboxCustomStyles property, and then define the source.
Note: Entering a source incorrectly can result in unexpected behavior in the geo charts, or cause Immerse to not load. Make sure that mapboxCustomStyles is an array, and that the objects in the array have label and value properties.
To avoid errors, consider using a JSON validator like JSON Lint to make sure the code is correctly formatted before starting Immerse.
The following example syntax shows how to add custom base maps using the mapboxCustomStyles property, in the following order:
- A custom map style created in Mapbox Studio and hosted on mapbox.com.
- A basemap style hosted on a Mapbox Atlas Server.
- A third-party OGC-compliant raster tiles source not affiliated with Mapbox. This source must adhere to the Mapbox Style Specification.
[
  {
        "database": "<database>",
        "password": "<password>",
        "url": "<omnisciserver>",
        "port": "<port_number>",
        "username": "<username>",
        "mapboxCustomStyles": [
          {
                "label": "custom-mapbox-studio-source",
                "value": "mapbox://styles/omnisci/<mapbox-studio-style-id>"
          },
          {
                "label": "mapbox-atlas-source",
                "value": "http://<domain>:<port>/pages/<style_name>/<style_name>.json"
          },
          {
                "label": "3rd-party-raster-source",
                "value": {
                  "version": 8,
                  "sources": {
                          "openstreetmap": {
                                  "type": "raster",
                                  "tiles": [
                                          "http://a.tile.openstreetmap.org/{z}/{x}/{y}.png",
                                          "http://b.tile.openstreetmap.org/{z}/{x}/{y}.png"
                                  ],
                                  "tileSize": 256
                          }
                  },
                  "layers": [{
                          "id": "openstreetmap",
                          "type": "raster",
                          "source": "openstreetmap",
                          "minzoom": 0,
                          "maxzoom": 22
                  }]
                }
          }
        ]
  }
]