Migrating Polygon Rendering and Hit-testing for Custom Clients Upgrading to OmniSci 4.0
If you imported polygon data into MapD 3.x for a custom app and are rendering and hit-testing that data, upgrading to OmniSci 4.0 or later and reimporting your polygon data breaks your rendering and hit-testing code because the storage model is different.
Use the following guide to migrate your existing polygon Vega-generation and hit-testing code to be compatible with OmniSci 4.0.
Polygons in MapD 3.x
In MapD 3.x, importing polygon data is considered BETA functionality and intended for rendering purposes only. You cannot perform geospatial queries against that data, and the projection is assumed to be Web Mercator. On import, four columns are generated to assist with rendering the polygons:
- omnisci_geo_coords: Array of the x/y coordinate pairs in Web Mercator projected space.
- omnisci_geo_indices: Array of indices into the omnisci_geo_coords array representing the triangulation of the polygon vertices for rendering.
- omnisci_geo_linedrawinfo: Array of a struct with the offsets/sizes for each polygon in omnisci_geo_coords.
- omnisci_geo_polydrawinfo: Array of a struct with the offsets/sizes for each polygon in omnisci_geo_indices.
Polygon Vega Rendering
Polygon rendering in MapD 3.x requires Vega code that maps the Web Mercator-projected vertices in omnisci_geo_coords to screen-space pixel locations. That mapping is done via a linear Vega scale; for example:
   width: 1183,
   height: 1059,
   data: [
     {
       name: "polys",
       format: "polys",
       sql: "SELECT rowid from zipcodes_2017"
     }
   ],
   scales: [
     {
       name: "proj_x",
       type: "linear",
       domain: [-13644429.98465946, -13592109.8239938],
       range: "width"
     },
     {
       name: "proj_y",
       type: "linear",
       domain: [4524477.448216146, 4570953.288472923],
       range: "height"
     }
   ],
   marks: [
     {
       type: "polys",
       from: {
         data: "polys"
       },
       properties: {
         x: {scale: "proj_x", field: "x"},
         y: {scale: "proj_y", field: "y"},
         fillColor: "red"
       }
     }
   ]
The scales proj_x and proj_y, highlighted in the code above, map Web Mercator coordinates to pixel coordinates. The domain for proj_x are the longitude values [-122.57, -122.1], and, the domain for proj_y are the latitude values [37.61, 37.94].
Polygon Hit-testing
When generating an SVG of polygon/multipolygon in the client upon a successful hit-test, you needed to do the following:
- Call the
get_result_row_for_pixel(...)method via amapd.thrift.jsjavascript module. The omnisci_geo_coords and omnisci_geo_linedrawinfo columns are used as part of thetable_col_namesargument to get the vertex coordinates and size/offsets for the polygons on a successful hit-test.NOTE: If using the mapd-connector JavaScript module, you likely would call the
getResultRowForPixel()wrapper method and pass the column information via thetableColNamesMapargument instead. - After a successful hit-test, you likely would have iterated over the data from the omnisci_geo_coords and omnisci_geo_linedrawinfo columns to manually build an SVG.
NOTE: The data from omnisci_geo_coords would be in Web Mercator coordinates, which would need to be converted to screen-space coordinates at some point, likely during building or drawing of the SVG.
Polygons in OmniSci 4.0
In OmniSci 4.0, polygon data is stored in a more general format that can be both queried (using geospatial functions such as st_contains and st_distance) and rendered. Therefore, the vertices of the polygon are no longer stored in Web Mercator; instead, they are stored in WGS84 coordinates if the polygons were imported with a spatial reference system.
Polygon Vega Rendering
Polygons are now imported with a spatial reference system and stored in WGS84 coordinates. So, you apply a cartographic projection to map the longitude/latitude values to pixels. In OmniSci 4.0, you do this using Vega Projections. The following Vega example renders polygons in OmniSci 4.0 using a Mercator cartographic projection:
 {
   width: 1183,
   height: 1059,
   data: [
     {
       name: "polys",
       format: "polys",
       sql: "SELECT rowid from zipcodes_2017"
     }
   ],
   projections: [
     {
       name: "merc",
       type: "mercator",
       bounds: {
         x: [-122.57, -122.1],
         y: [37.61, 37.94],
       }
     }
   ],
   marks: [
     {
       type: "polys",
       from: {
         data: "polys"
       },
       properties: {
         x: {field: "x"},
         y: {field: "y"},
         fillColor: "red"
       }
       transform: {
         projection: "merc"
       }
     }
   ]
 }
Currently, Web Mercator is the only Vega projection supported.
Polygon Hit-testing
During polygon import in OmniSci 4.0, a publicly accessible geo column is created. This column name defaults to omnisci_geo, but can be named differently. This is the only column required to extract the polygon geometry for hit-testing. When hit-testing using omnisci_geo, a WKT string is returned representing the polygon geometry, instead of an arrow of coordinates.
The polygon vertices in the WKT string are in WGS84 coordinates if the polygons were imported with a spatial reference system.
Converting WKT to SVG
Now that the geometry data is returned in a common format, many tools and libraries are available to convert WKT to SVG. In OmniSci Immerse, two libraries are used to perform the conversion:
- wellknown - Converts WKT to geojson.
-
d3-geo - Uses the
d3.geoPath()function to convert the geojson to an SVG. See d3-geo Paths for more information. This handles the projection to screen space as well.
Migrating from 3.x to 4.0
After reimporting your polygon geometry in OmniSci 4.0, the vertices are now stored in WGS84 coordinates. To migrate polygon rendering from OmniSci 3.x to OmniSci 4.0:
- Add a new projection block to your Vega code using a Mercator projection, following this template:
projections: [ { name: "merc", type: "mercator", bounds: { x: [, ], y: [ , ], } } ] - Remove any unreferenced WebM Mercator-to-pixel scales. Although not required because any unused scales are ignored, removing the scales keeps your Vega code clean.
- Reference the new Mercator projection in a
transformblock in your polys marks; for example:{ type: "polys", from: {data: "polys"}, properties: { … } transform: { projection: "merc" } }
To migrate your polygon hit-testing and SVG generation from MapD 3.x to OmniSci 4.0:
- Replace the omnisci_geo_coords and omnisci_geo_linedrawinfo columns with omnisci_geo (or whatever you name the geo colum)
in the
get_result_row_for_pixelcall (orgetResultRowForPixelif you use mapd-connector). - Convert the WKT returned on a successful hit-test to SVG. You can use one of several exising libraries instead of constructing the SVG manually.
Example: SVG Drawing Code in OmniSci 4.0
Following is the HTML/JavaScript code demonstrating the primary aspects of constructing an SVG on the client in a successful poly hit-test. This snippet is not intended to fully replace your existing code; instead, it shows you the main flow and structure to use when migrating.
Shapefile
The example uses a US zipcodes shapefile from 2017, which can be downloaded as a zip file. If you are using omnisql, run the following command to import the downoaded zip file, replacing <zip path>
with the absolute path name where the above zip file can be found:
omnisql> COPY zipcodes_2017 FROM '<zip path>' WITH (geo='true');
The zipcodes_2017 table has the following structure after import:
omnisql> \d zipcodes_2017
CREATE TABLE zipcodes_2017 (
ZCTA5CE10 TEXT ENCODING DICT(32),
AFFGEOID10 TEXT ENCODING DICT(32),
GEOID10 TEXT ENCODING DICT(32),
ALAND10 BIGINT,
AWATER10 BIGINT,
omnisci_geo GEOMETRY(MULTIPOLYGON, 4326) ENCODING COMPRESSED(32))
Notice that the omnisci_geo column from the import is a MULTIPOLYGON with a spatial reference system of EPSG:4327 WGS 84 and has compressed coordinates.
Libraries
The following libraries are used in this example:
Example Code
<!DOCTYPE html>
<html lang="en">
<head>
<title>OmniSci Polygon 4.0 SVG Hittest Example</title>
<meta charset="UTF-8">
<style>
path {
fill: orange;
stroke: #DDD;
stroke-width: 1px;
}
</style>
</head>
<body>
<script src="https://d3js.org/d3-selection.v1.min.js"></script>
<script src="https://d3js.org/d3-array.v1.min.js"></script>
<script src="https://d3js.org/d3-geo.v1.min.js"></script>
<script src="js/wellknown.js"></script>
<script src="js/browser-connector.js"></script>
<script>
function init() {
/**
* Define the server and login configuration
*/
config = {
protocol: <http/https>,
hostname: <hostname>,
port: <port>,
db: <db name>,
user: <user name>,
password: <user password>
}
/**
* Define the width/height of the resulting image
* and the longitude/latitude bounds of the mercator projection
*/
const width = 1183
const height = 1059
const latlonBounds = [[-122.57, 37.61], [-122.1, 37.94]]
/**
* The name of the geo column with the polygon data. omnisci_geo is the default name
*/
const geoColumn = "omnisci_geo"
/**
* Below is the example vega to use. The "zipcodes_2017" table used below can be found
* here: https://www.census.gov/geo/maps-data/data/cbf/cbf_zcta.html
*
* You can just wget it using this command:
* wget www2.census.gov/geo/tiger/GENZ2017/shp/cb_2017_us_zcta510_500k.zip -O zipcodes_2017.zip
*
* Then import into OmniSci. Via omnisql, you can run the following command:
* omnisql> COPY zipcodes_2017 FROM '<path to>/zipcodes_2017.zip' WITH (geo='true');
*
* These are the columns created:
* omnisql> \d zipcodes_2017
*
* CREATE TABLE zipcodes_2017 (
* ZCTA5CE10 TEXT ENCODING DICT(32),
* AFFGEOID10 TEXT ENCODING DICT(32),
* GEOID10 TEXT ENCODING DICT(32),
* ALAND10 BIGINT,
* AWATER10 BIGINT,
* omnisci_geo GEOMETRY(MULTIPOLYGON, 4326) ENCODING COMPRESSED(32))
*
* You will notice that a omnisci_geo column exists and it is a multipolygon with
* spatial reference system 4326 (WGS84): http://spatialreference.org/ref/epsg/4326/
* You will also notice that the coordinates are compressed by default.
*/
const vega = {
width: width,
height: height,
data: [
{
name: "zipcodes",
format: "polys",
sql: "SELECT rowid, ALAND10 as area from zipcodes_2017"
},
{
name: "stats",
source: "zipcodes",
transform: [
{
type: "aggregate",
fields: ["area"],
ops: [{ type: "quantile", numQuantiles: 8 }],
as: ["quantileval"]
}
]
}
],
projections: [
{
name: "merc",
type: "mercator",
bounds: {
x: [latlonBounds[0][0], latlonBounds[1][0]],
y: [latlonBounds[0][1], latlonBounds[1][1]]
}
}
],
scales: [
{
name: "polys_fillColor",
type: "threshold",
domain: { data: "stats", field: "quantileval" },
range: [
"rgb(0,0,255)",
"rgb(36,0,219)",
"rgb(72,0,183)",
"rgb(108,0,147)",
"rgb(147,0,108)",
"rgb(183,0,72)",
"rgb(219,0,36)",
"rgb(255,0,0)"
],
nullValue: "#cacaca"
}
],
marks: [
{
type: "polys",
from: { data: "zipcodes" },
properties: {
x: { field: "x" },
y: { field: "y" },
fillColor: { scale: "polys_fillColor", field: "area" },
strokeColor: "black",
strokeWidth: 1,
lineJoin: "round"
},
transform: { projection: "merc" }
}
]
}
// Now create a new connection to OmniSci
var conn = new OmniSciCon()
.protocol(config.protocol)
.host(config.hostname)
.port(config.port)
.dbName(config.db)
.user(config.user)
.password(config.password)
.connect(function (error, con) {
if (error) {
throw error
}
// run a serialized renderVega() call and immediately get the results
var results = con.renderVega(1, JSON.stringify(vega))
// get the resulting PNG and build a base64 blob data URL
var blobUrl = 'data:image/png;base64,' + results.image;
// Now add the PNG to an img element, parented under a parent div
const body = d3.select(document.body)
var div = body.append("div").style("position", "relative")
var img = div.append("img").attr("src", blobUrl).attr("alt", "backend-rendered png")
// Now do a hit-test check. Note that in the BE, the lower left-hand corner of the image
// is pixel (0, 0), so we have to invert y.
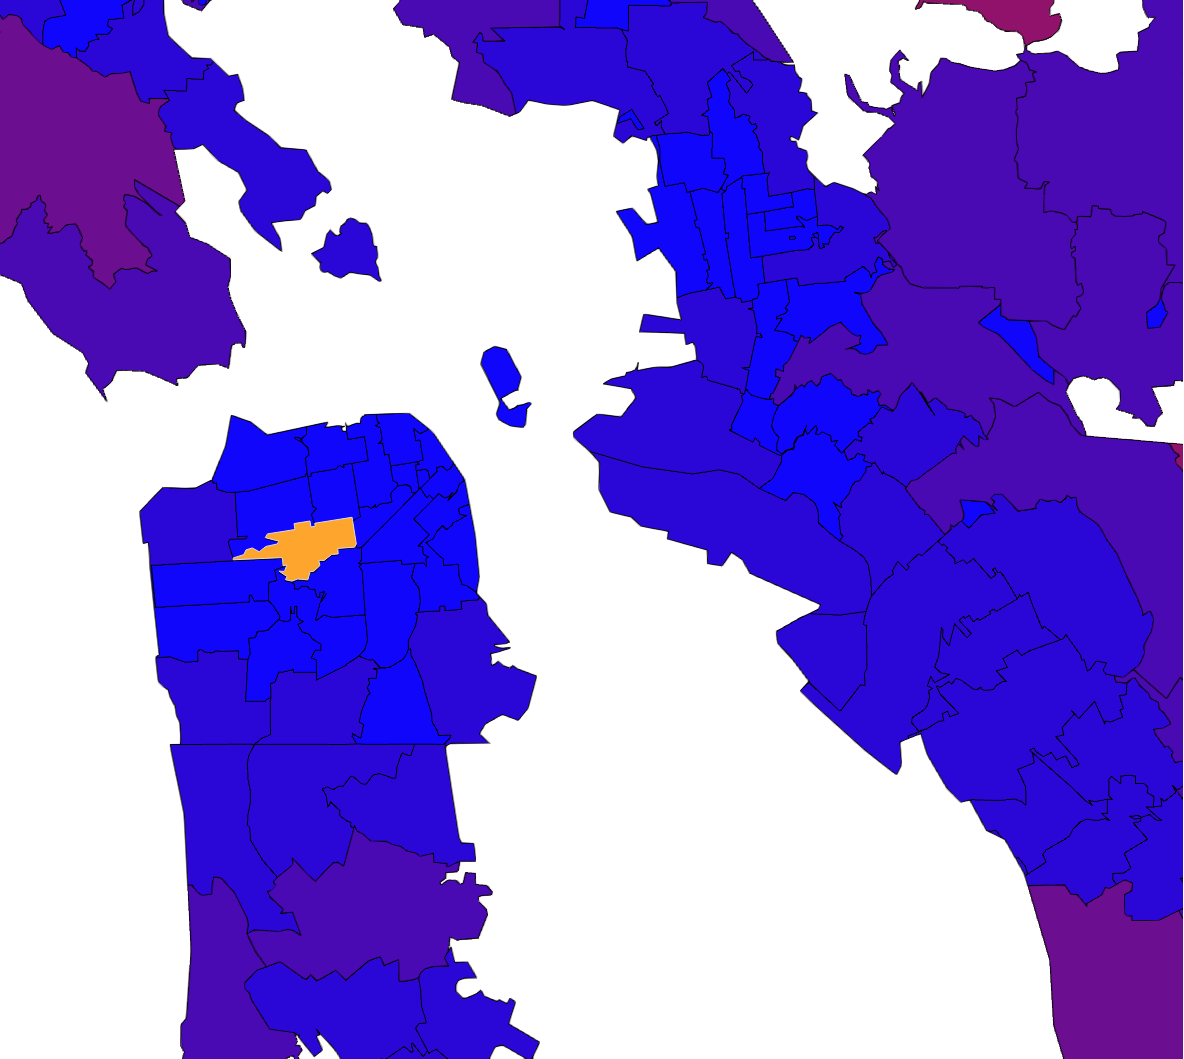
// The pixel used here: (326, 514) hits the zipcode 94117 for this render
con.getResultRowForPixel(
1, // widgetId
new TPixel({ x: 326, y: height - 544 - 1 }), // The pixel to hit-test, with Y inverted
{ zipcodes: [geoColumn] }, // Get the polygon column data on a successful hit-test
// 'omnisci_geo' is the default polygon geo column name
(err, data) => { // Provide an asynchronous callback for the hit-test results
if (err) {
throw err
}
// check if we got a successful hit-test result. The rowid >= 0 if that's the case
if (data.length && data[0].row_id >= 0) {
if (!data[0].row_set.length) {
throw new Error("Invalid result set returned from poly hit-test", data);
}
// the polygon geo column will be a wkt string:
// https://en.wikipedia.org/wiki/Well-known_text
const wkt = data[0].row_set[0][geoColumn]
if (typeof wkt !== "string") {
throw new Error(
`Cannot create SVG from geo polygon column "${geoColumn}". The data returned is not a WKT string. It is of type: ${typeof wkt}`
)
}
// We'll use the wellknown library from mapbox to convert the wkt string to geojson
// https://github.com/mapbox/wellknown
const geojson = wellknown.parse(wkt)
if (geojson.type !== "MultiPolygon" && geojson.type !== "Polygon") {
throw new Error(`Cannot create SVG from geojson ${geojson}. Currently only Polygon/MultiPolygon is supported`)
}
// Now we'll build out a d3 mercator projection used to position the resulting SVG into
// screen space coordinates
// the center of the projection will be the center of the defined lat/lon bounds
const centerLon = latlonBounds[0][0] + (latlonBounds[1][0] - latlonBounds[0][0]) / 2
const centerLat = latlonBounds[0][1] + (latlonBounds[1][1] - latlonBounds[0][1]) / 2
// now setup a default projection centered in the middle of our div on the middle of our
// defined lat/lon bounds
const projection = d3.geoMercator()
.center([centerLon, centerLat]) // Center the projection on the center of our bounds
.scale(1) // set a default scale for the projection.
// We'll calculate a real scale later
.translate([width / 2, height / 2]) // Translate the center of the projection to be
// in the middle of our div, otherwise it'll be in
// the top-left corner
// now get the X coordinates of the pixel locations of our left/right bounds edge
// using the default projection. We'll use this as a base of our scale
const baseMinLon = projection(latlonBounds[0])[0]
const baseMaxLon = projection(latlonBounds[1])[0]
// Now reset the projection's scale. This will now be in line with the
// vega render
projection.scale(width / (baseMaxLon - baseMinLon))
// now build the svg - build the parent svg view
const svg = div.append("svg")
.style("position", "absolute")
.style("left", 0)
.style("width", width)
.style("height", height)
// now build the path. We're using d3.geoPath to automatically build the
// svg path string.
svg.append("path")
.datum(geojson)
.attr("d", d3.geoPath(projection))
}
}
)
});
}
document.addEventListener('DOMContentLoaded', init, false);
</script>
</body>
</html>
Result
The previous code results in the following: